|
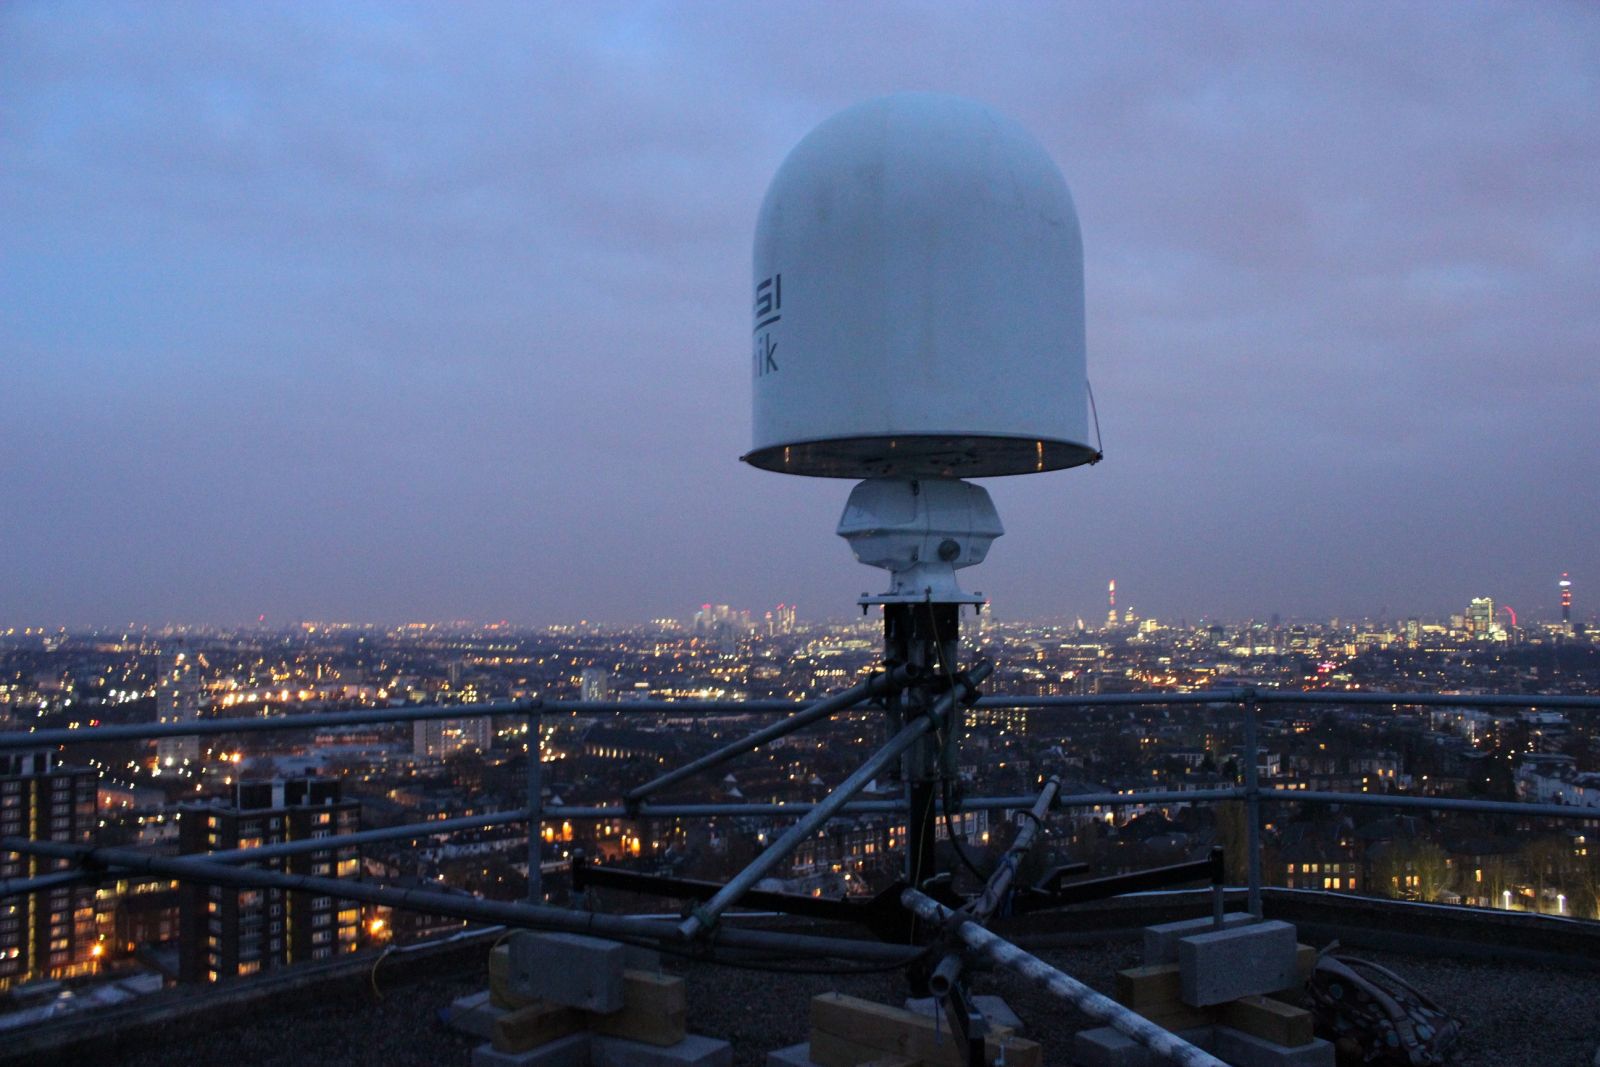
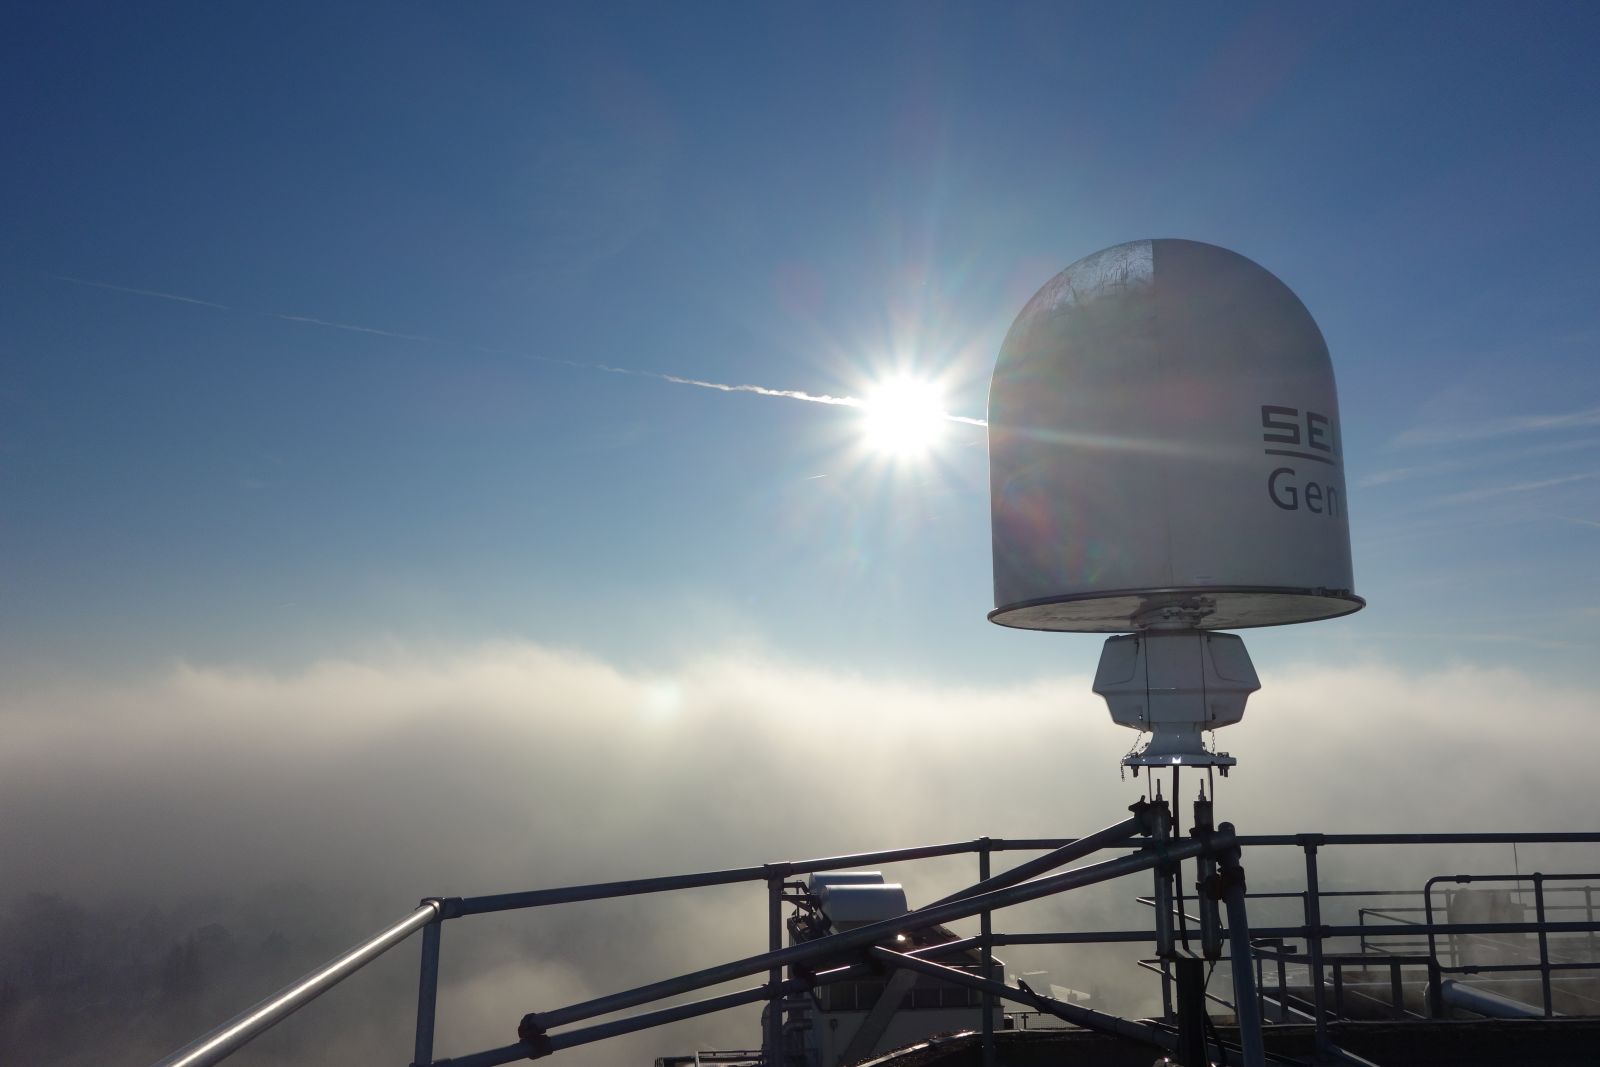
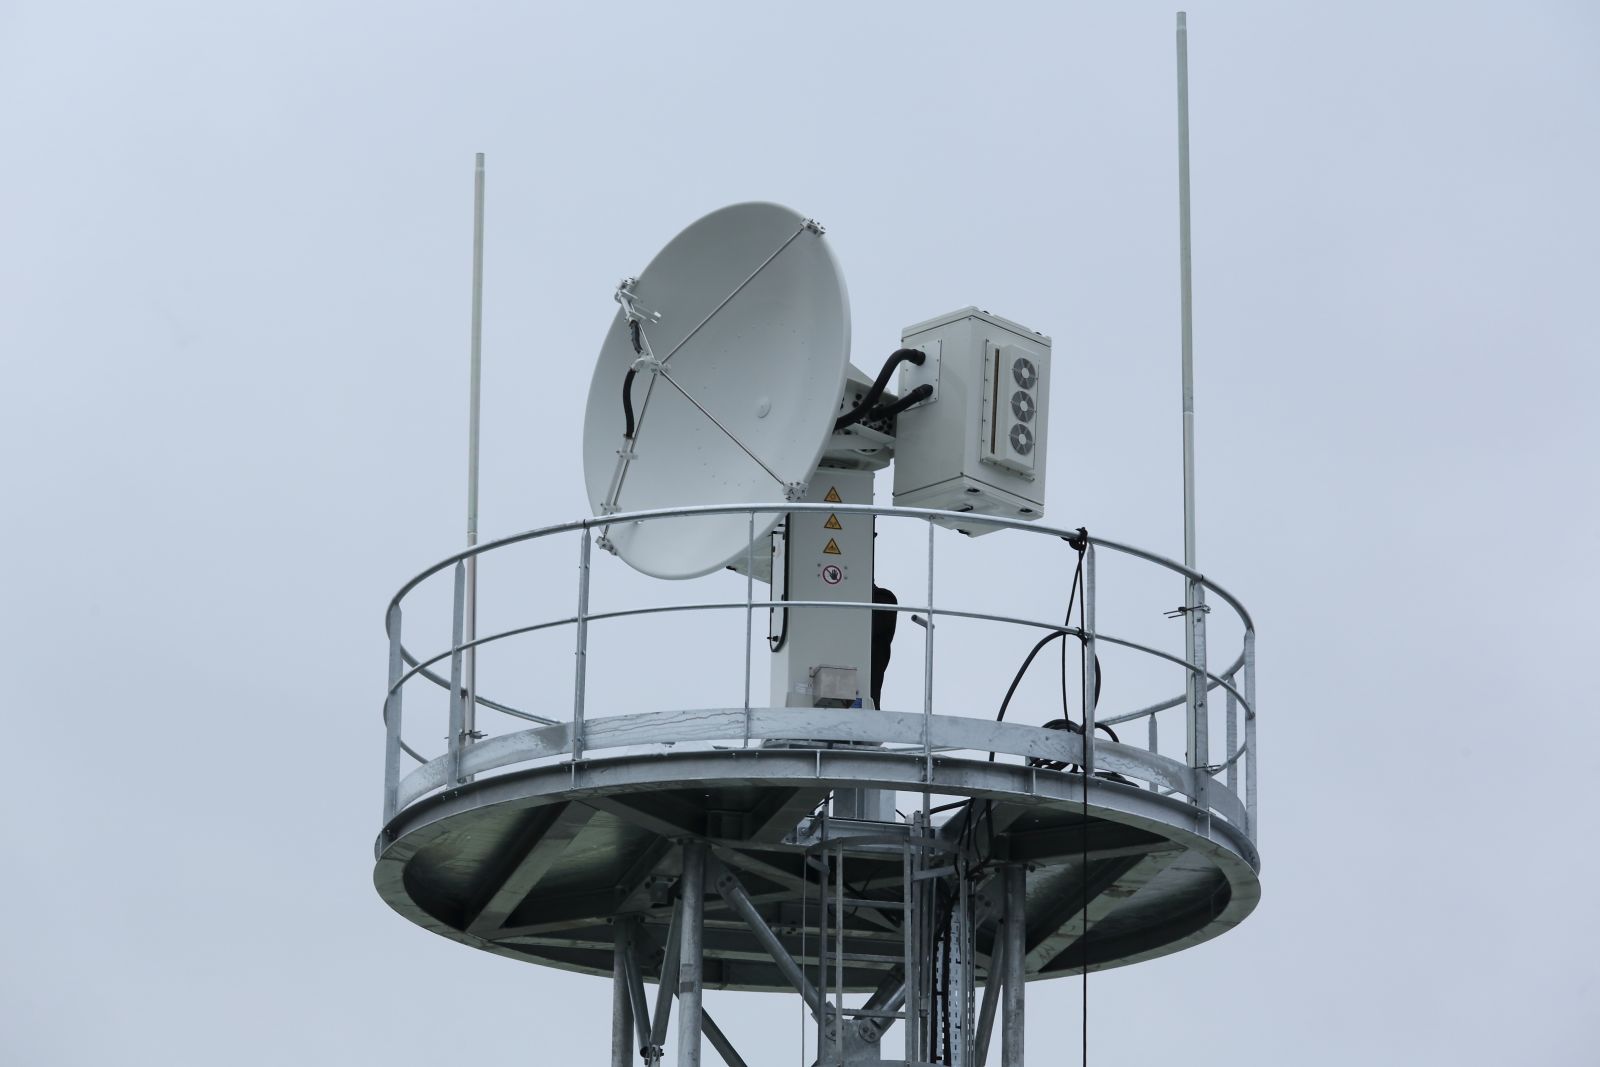
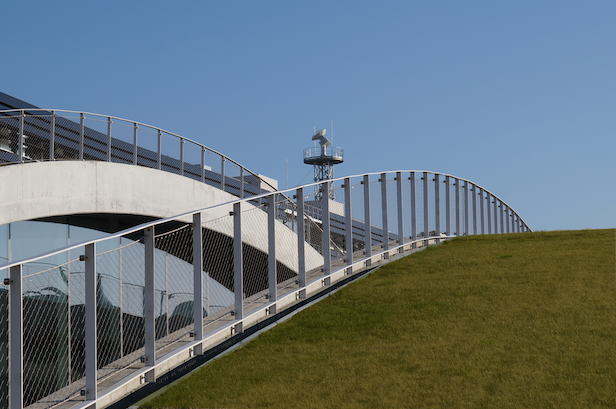
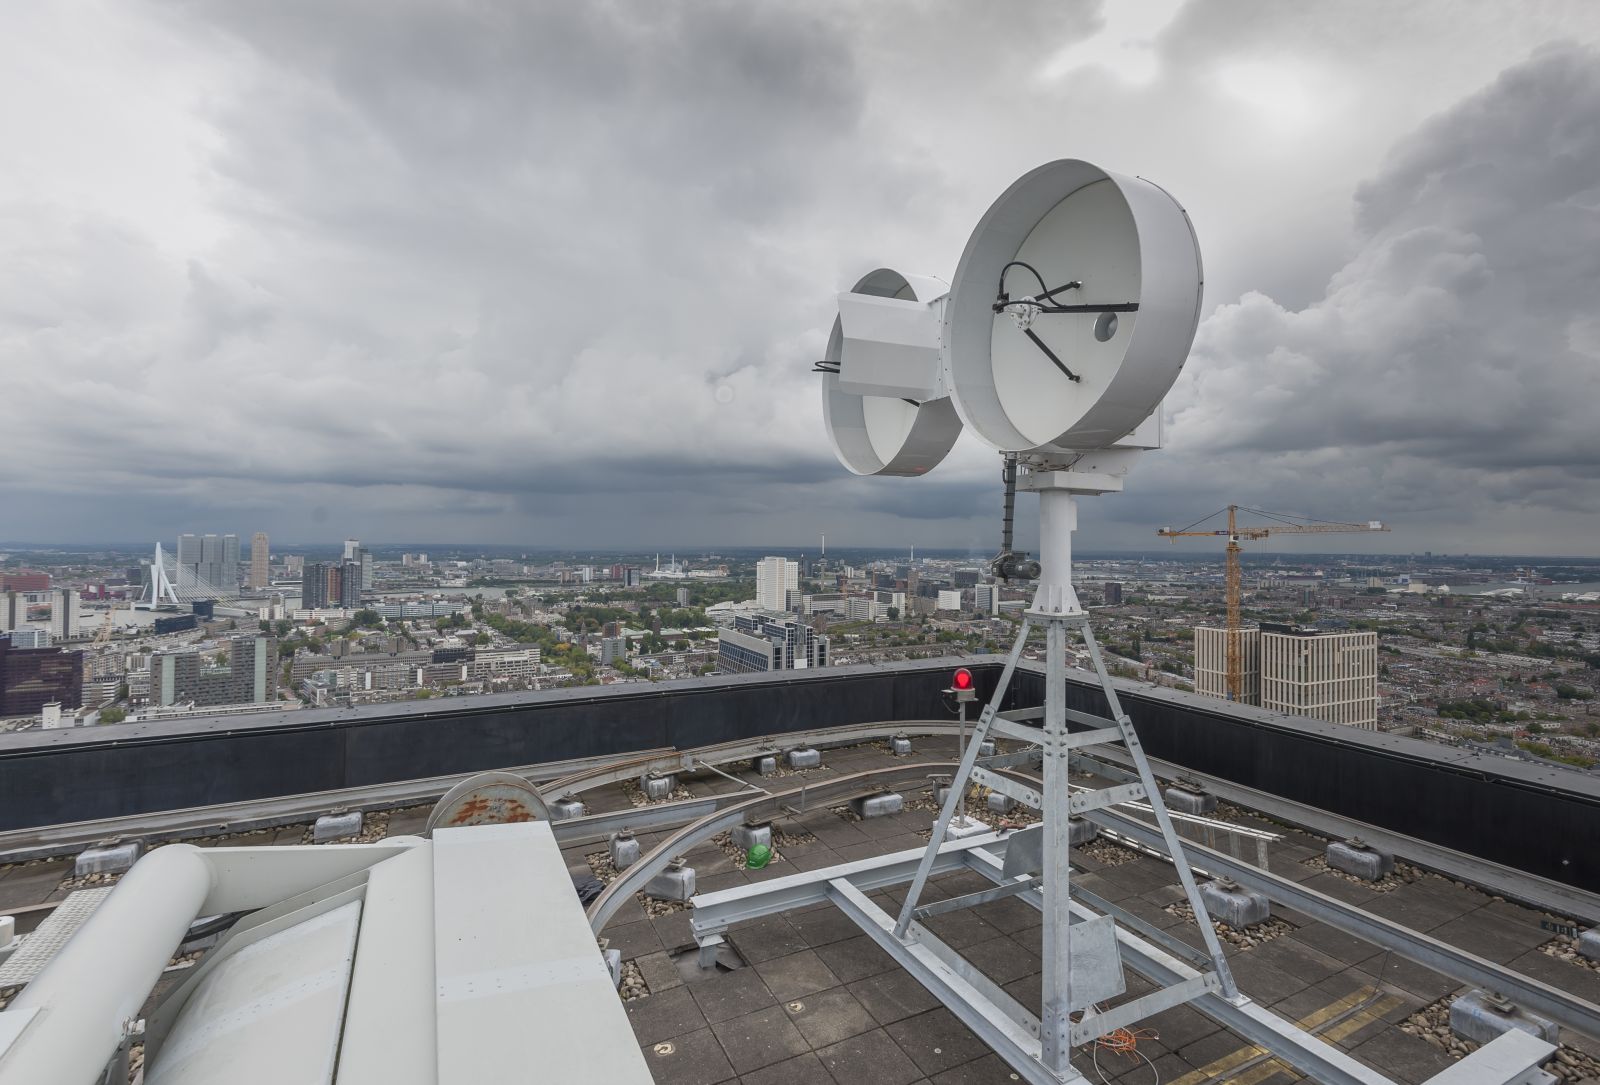
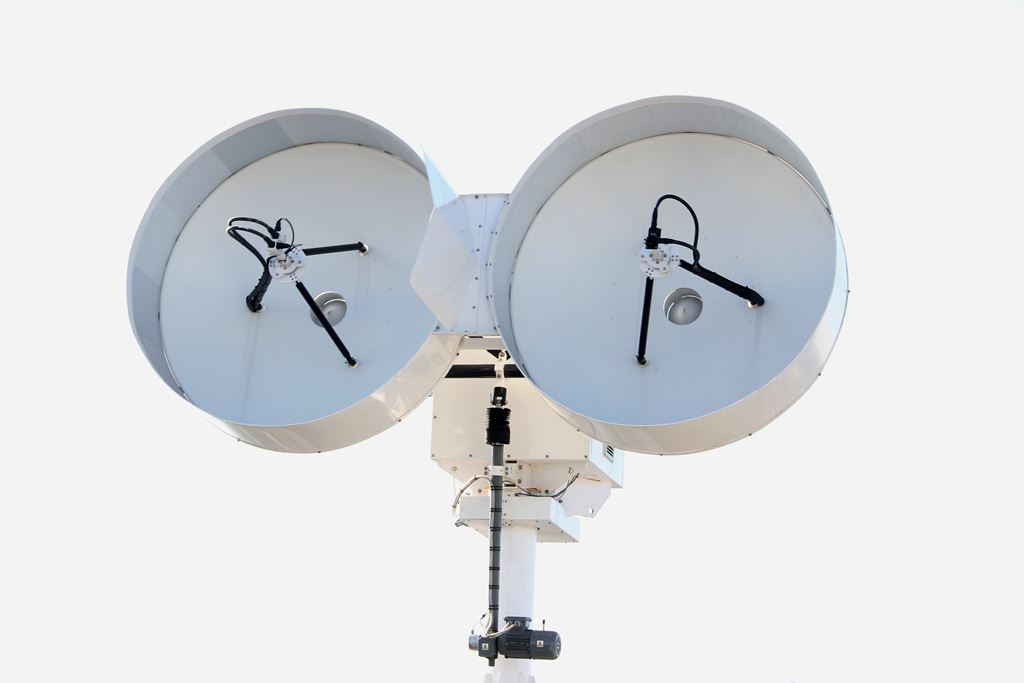
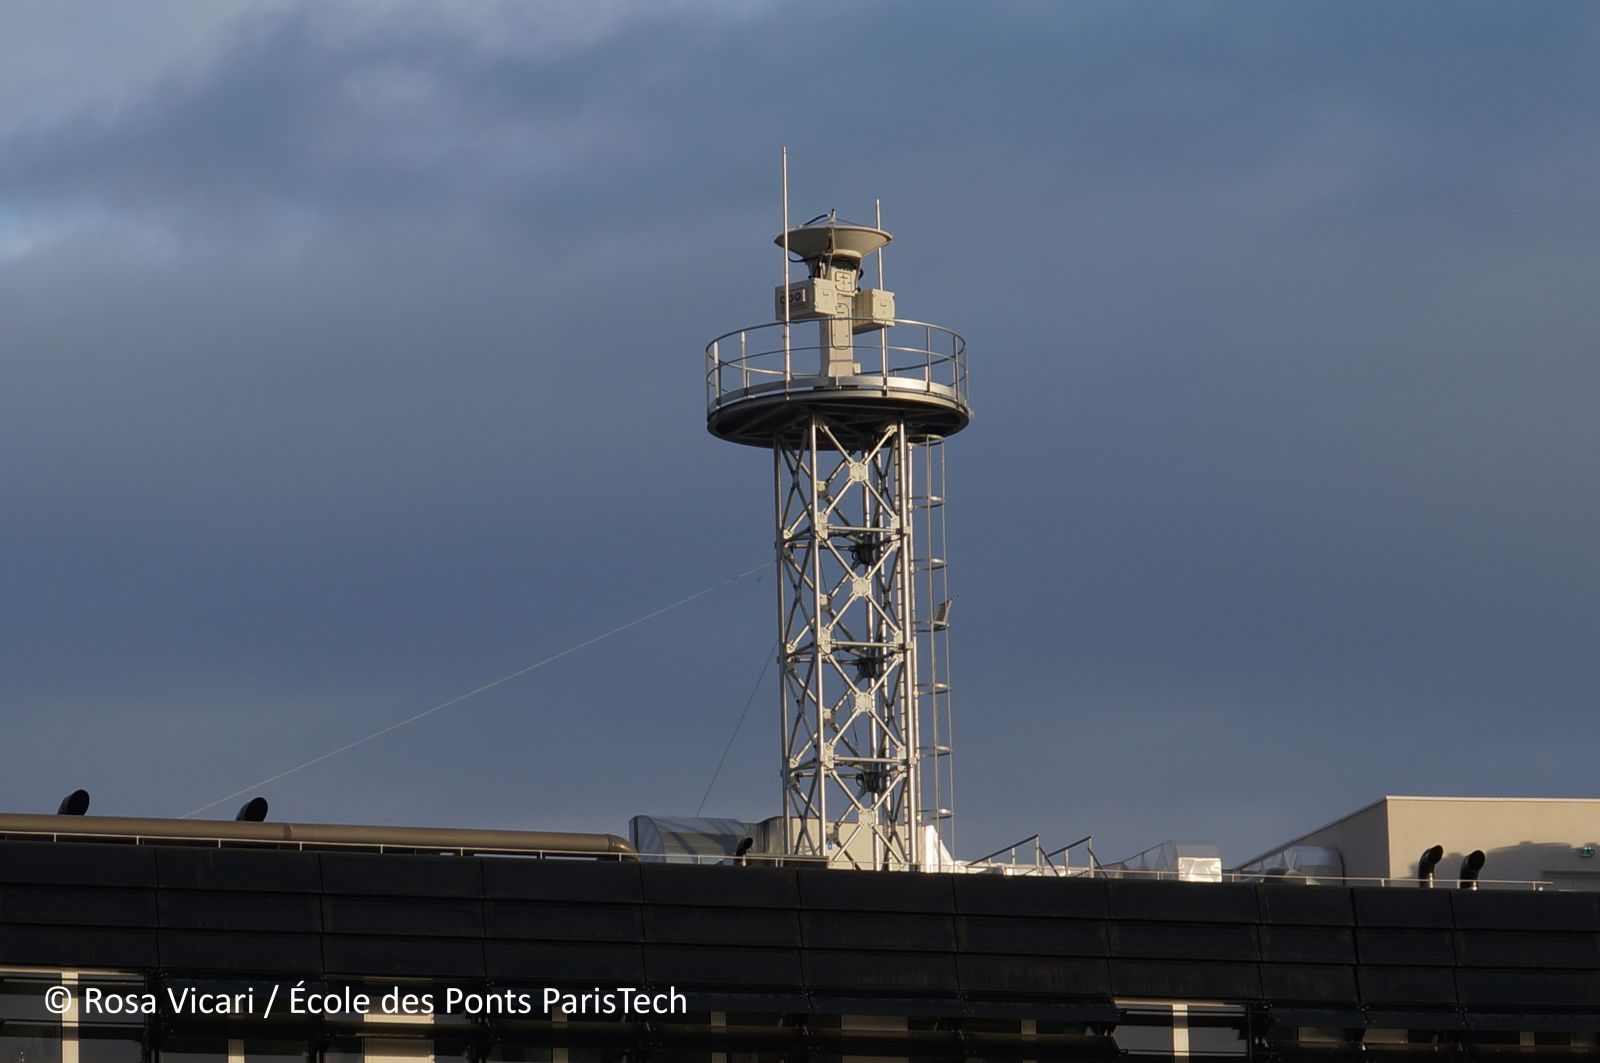 The X-band radar of École des Ponts ParisTech. Credits: Rosa Vicari / École des Ponts ParisTech The X-band radar of École des Ponts ParisTech. Credits: Rosa Vicari / École des Ponts ParisTech
|
Daniel Schertzer on front of the radar of École des Ponts ParisTech. Photo credits: Yann Piriou / SMD
|
The X-band radar of École des Ponts ParisTech. Credits: Yann Piriou/SMD
|
|
New waves are coming. Champs-sur-Marne / France; 2015. Photo credits: Rosa Vicari/Ecole des Ponts ParisTech.
|
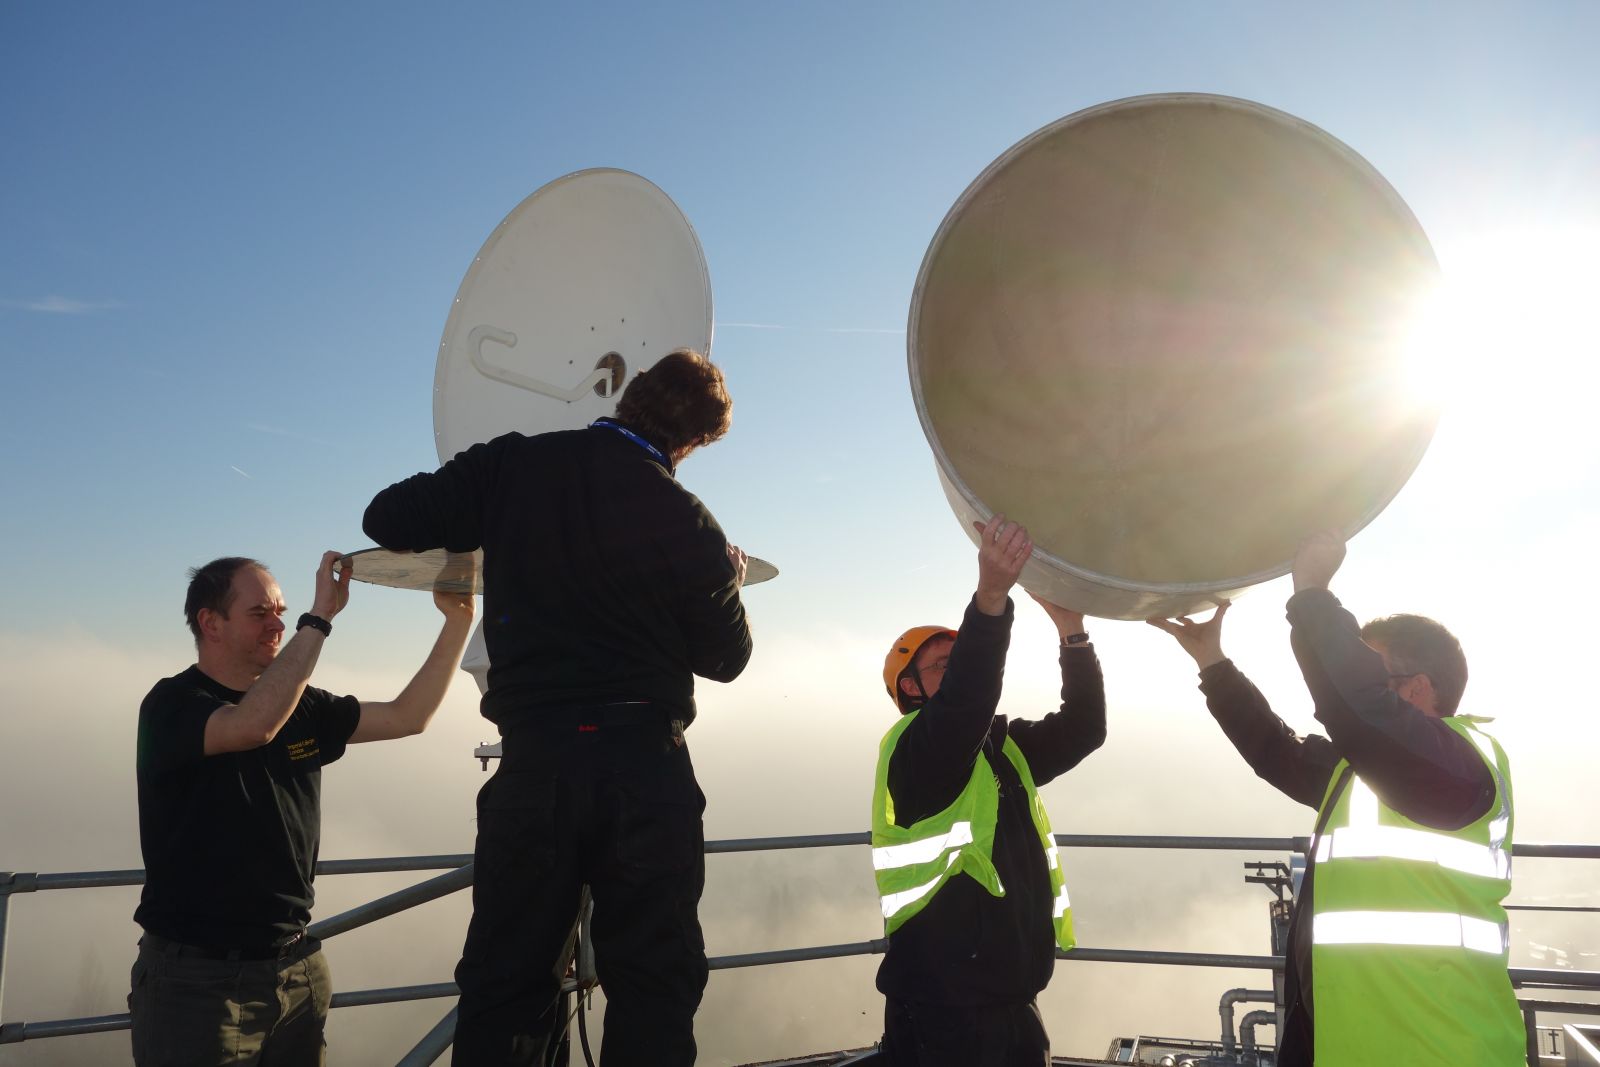
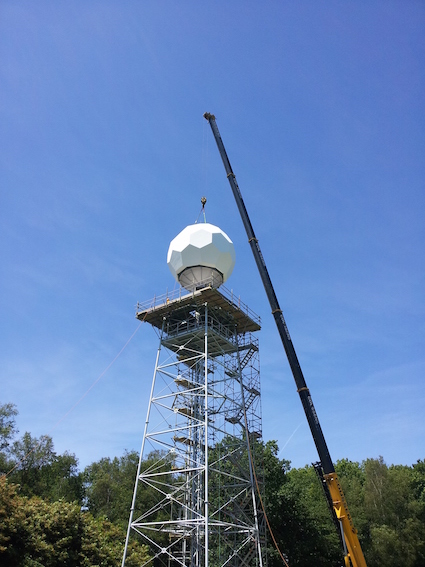
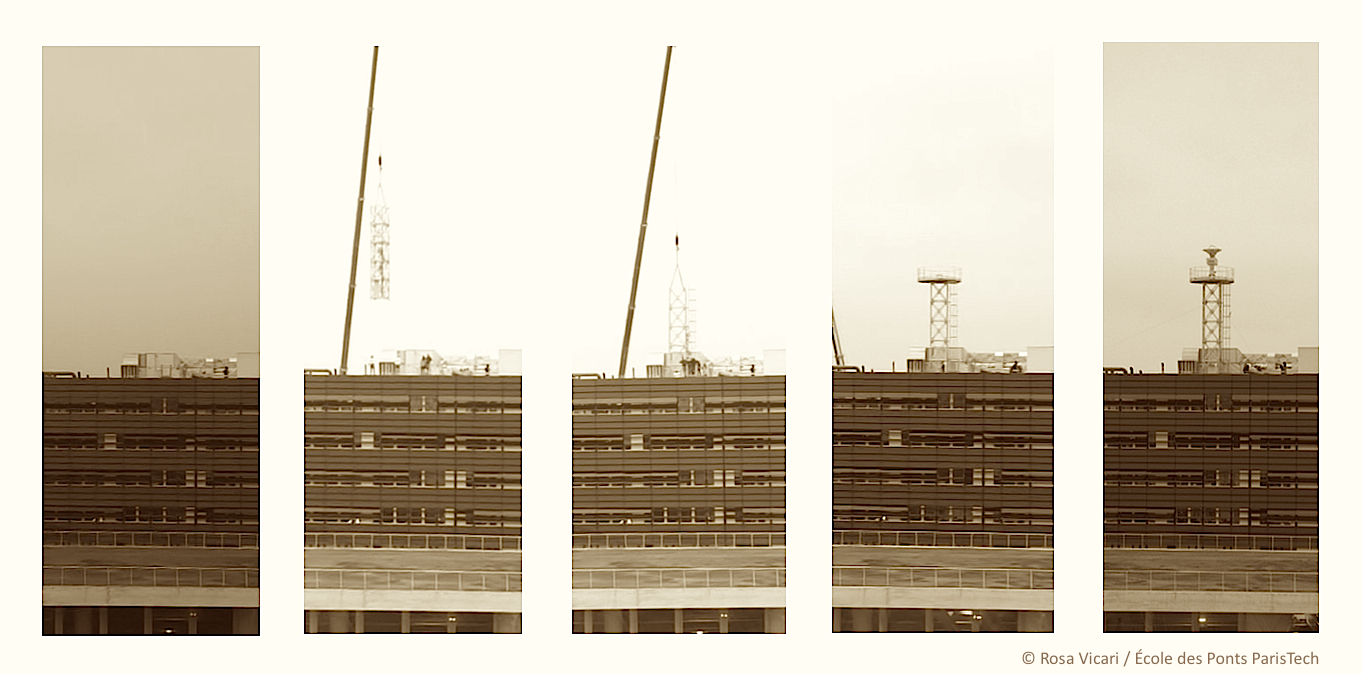
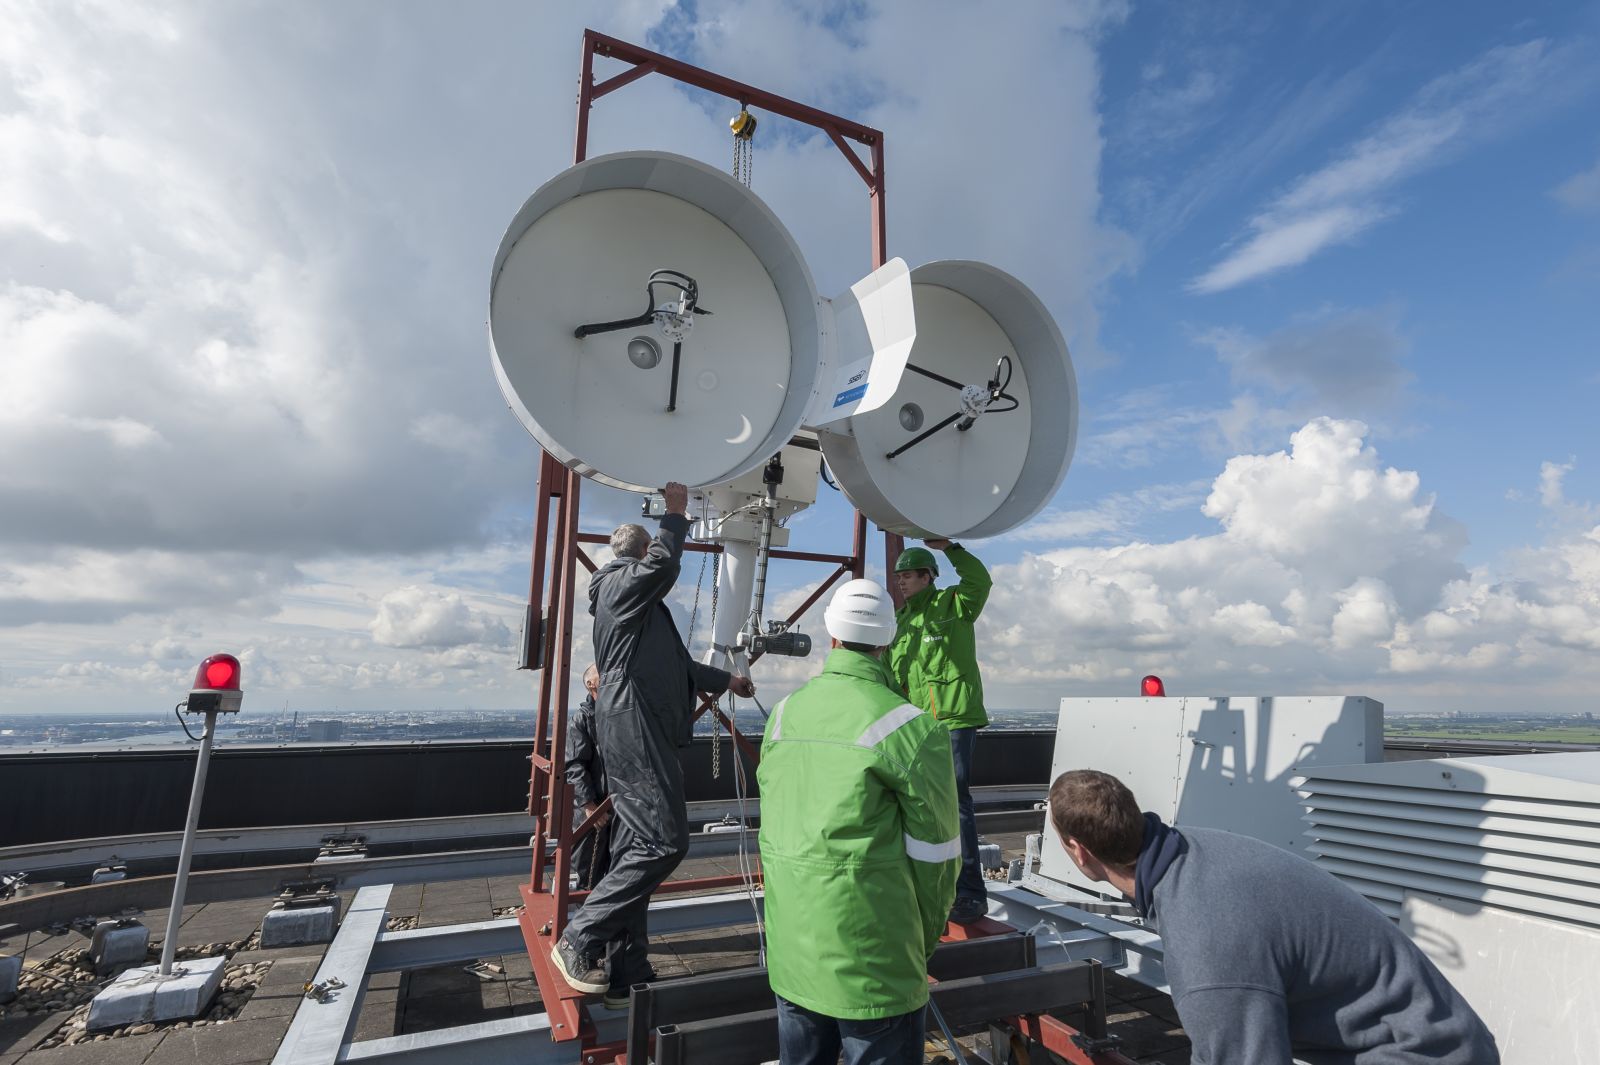
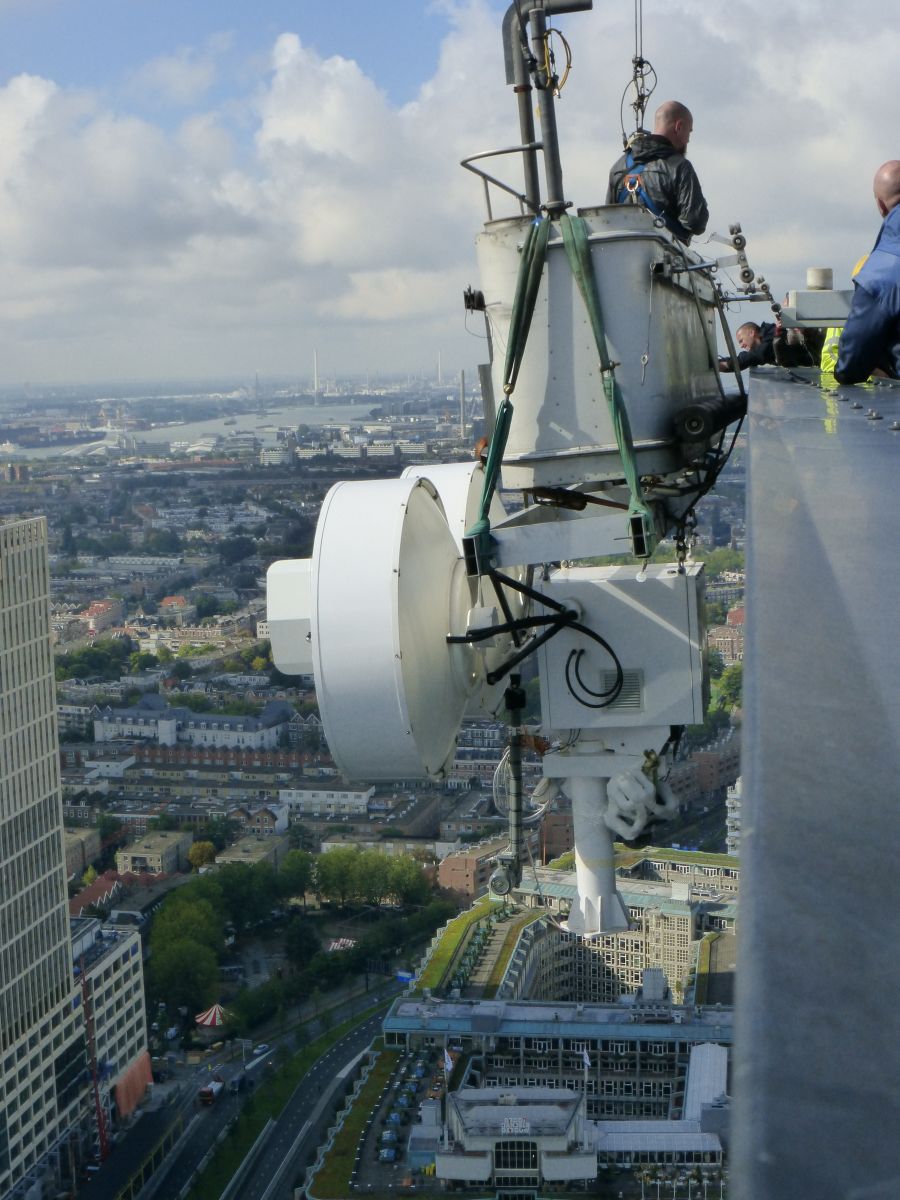
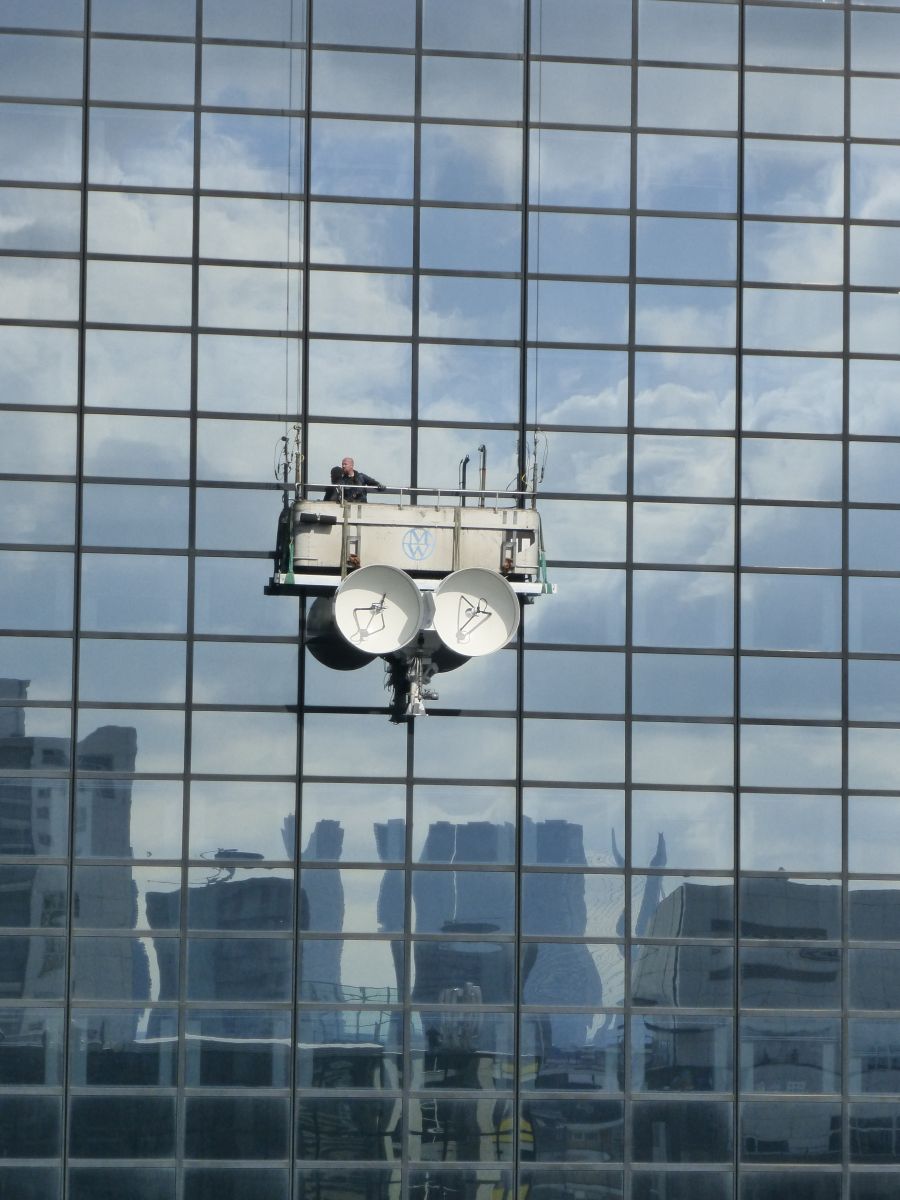
The installation of the X-band dual polarization radar at École des Ponts ParisTech. Champs-sur-Marne / France, 2014. Photo credits: Rosa Vicari / École des Ponts ParisTech.
|
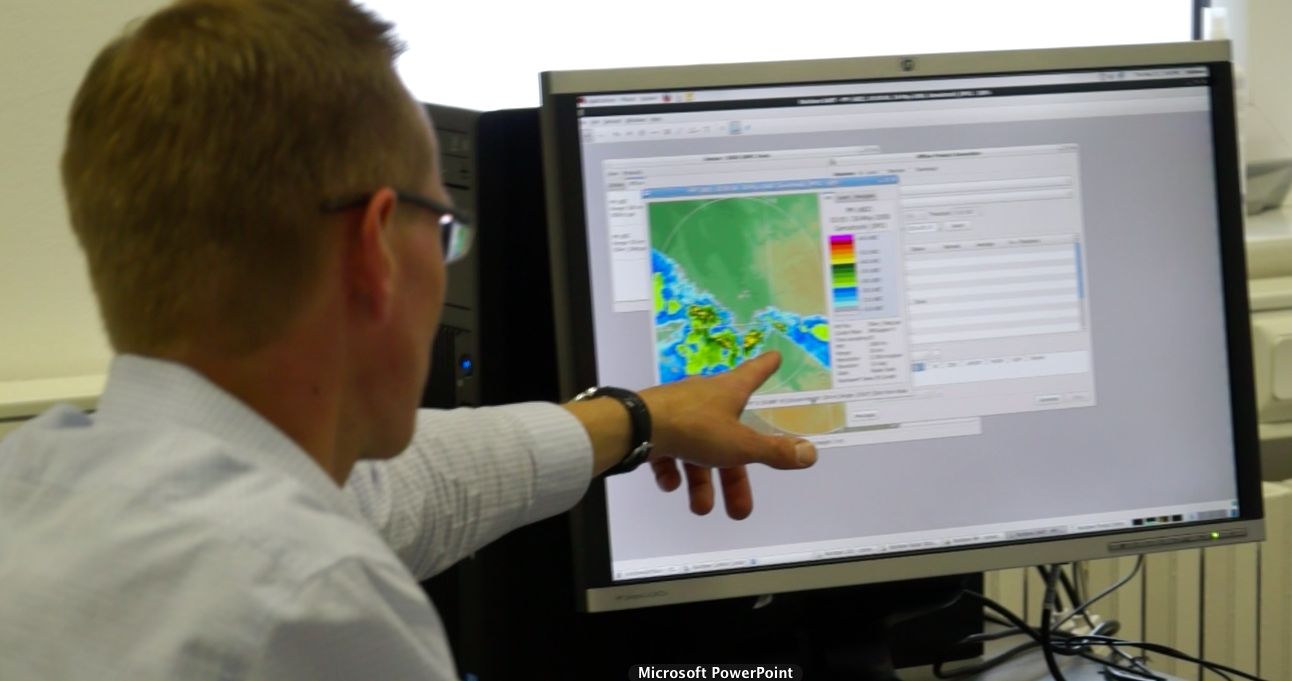
Presentation of RAINBOW, a software for radar data analysis and display that is currently used by École des Ponts ParisTech. Selex factory in Dusseldorf; 2014. Photo credits: Rosa Vicari / École des Ponts ParisTech.
|
|
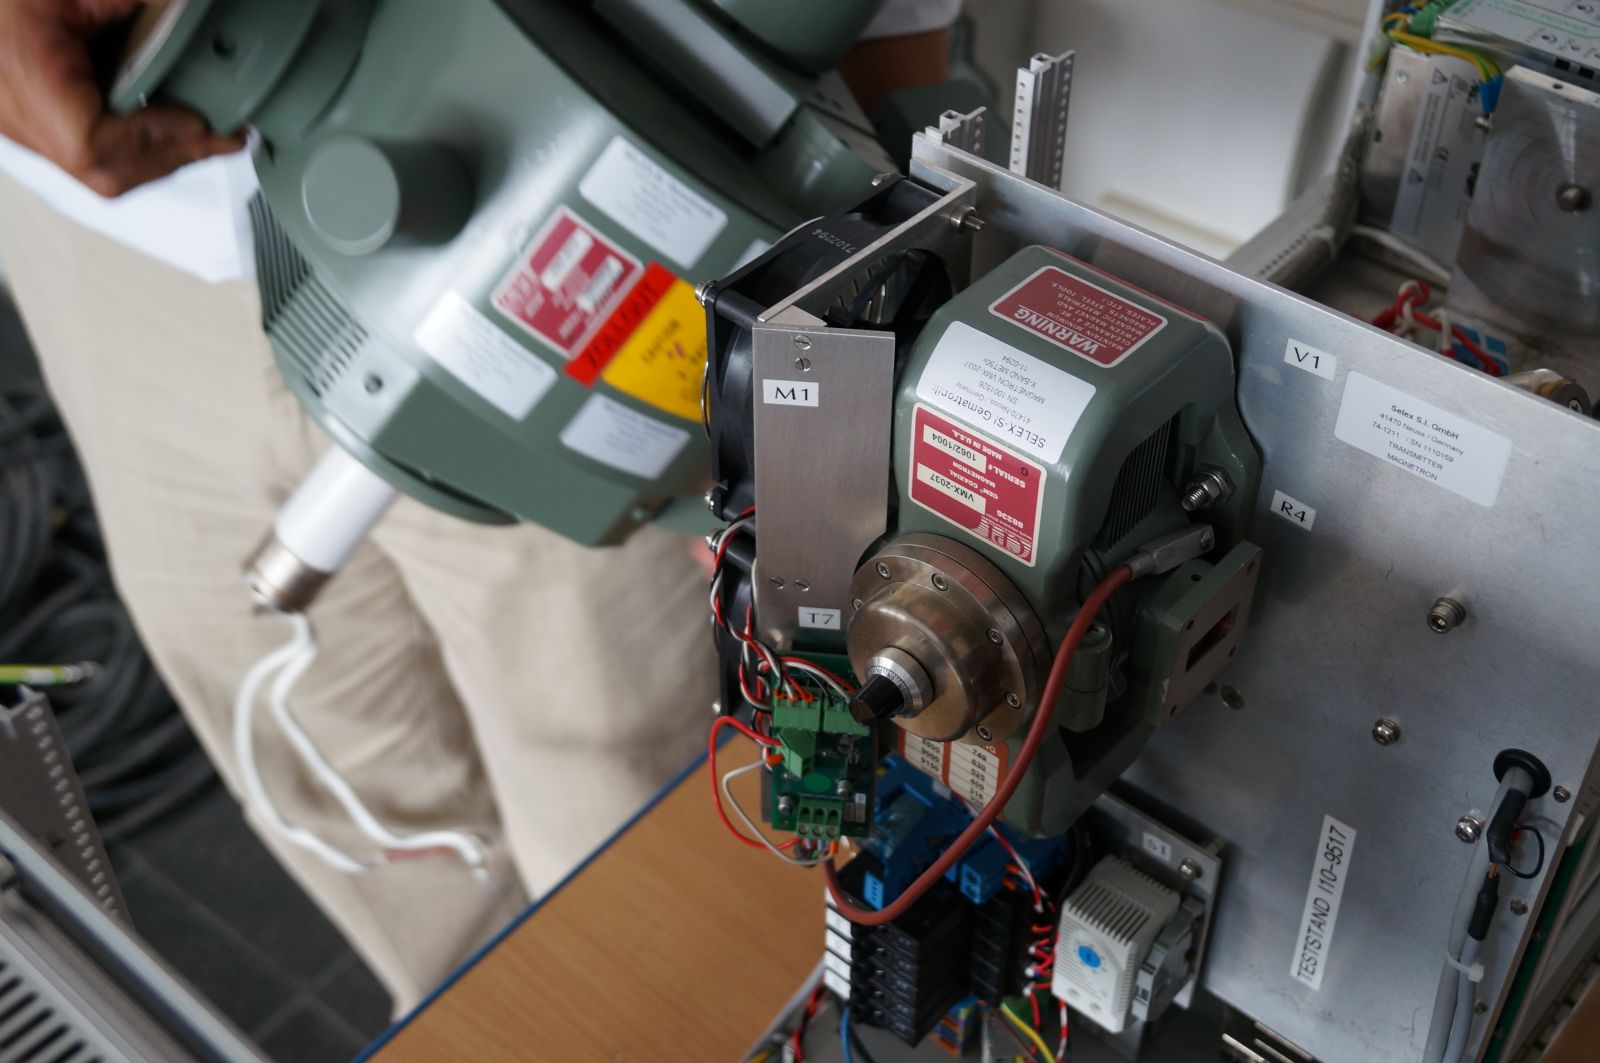
A C-band radar’s magnetron beside a smaller X-band radar’s magnetron. Selex factory in Dusseldorf; 2014. Photo credits: Rosa Vicari / École des Ponts ParisTech.
|
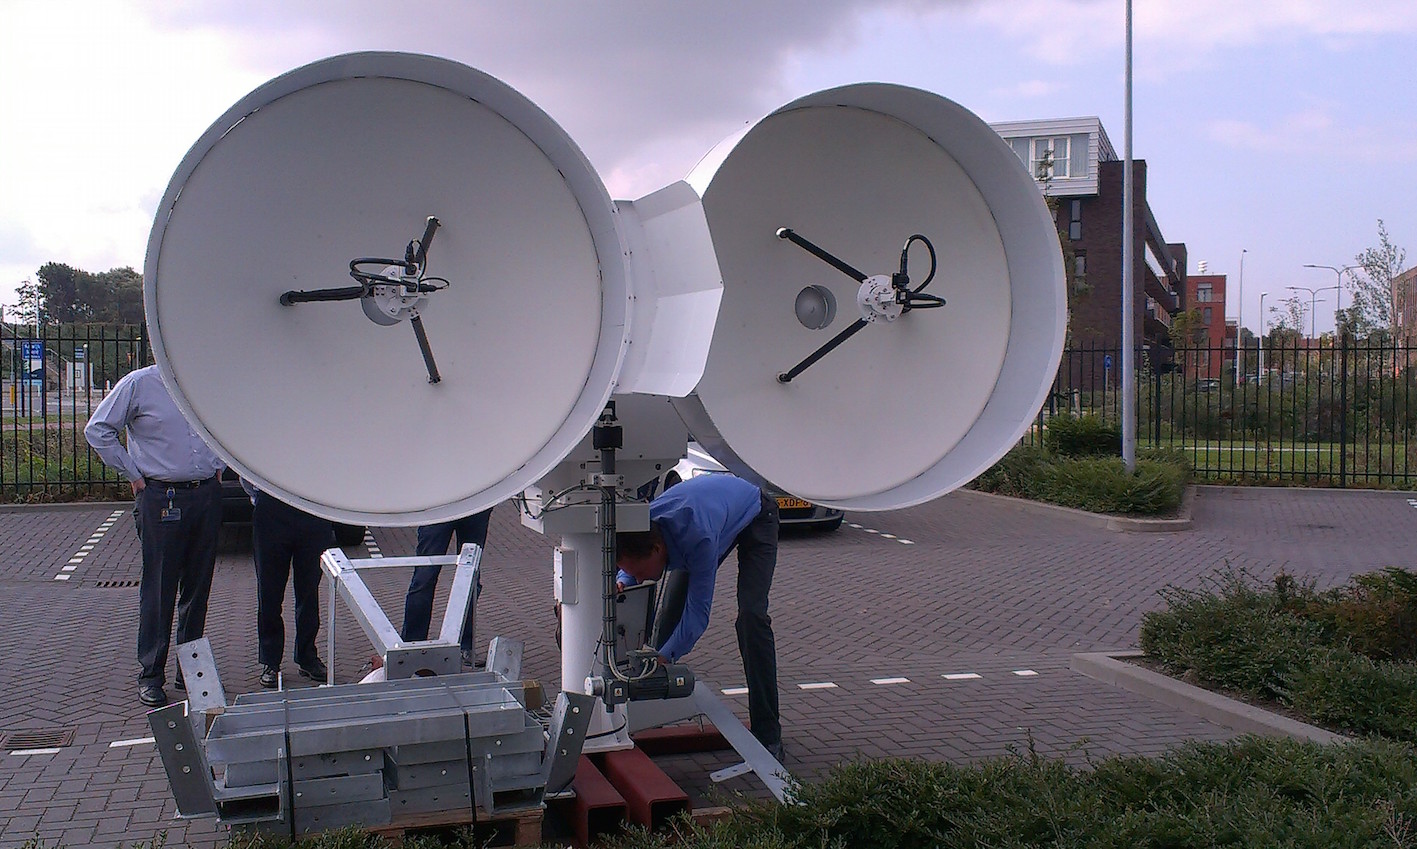
The dual polarization X-band radar installed at École des Ponts ParisTech provides rainfall data at street scale and with a precision of one minute, it was co-funded by the EU’s Interreg NWE IVB Programme, by Veolia through the Chair Hydrology for Resilient Cities and by Île-de-France Region. Champs-sur-Marne / France; 2015. Photo credits: Auguste Gires / École des Ponts ParisTech.
|
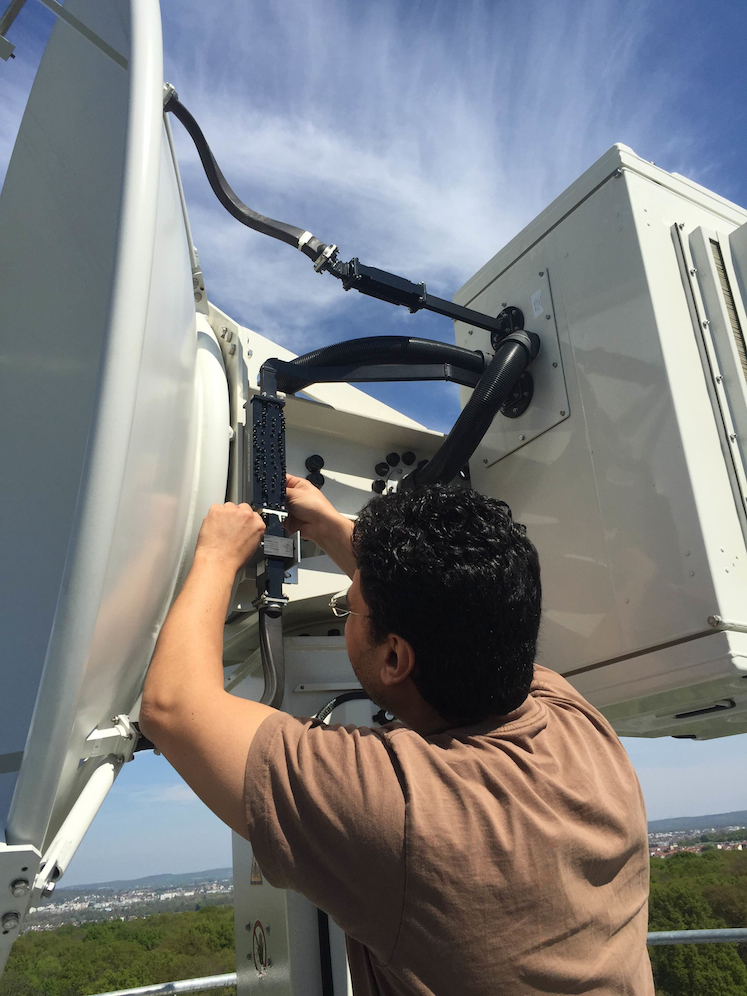
Installation of a frequency filter on the X-band radar of École des Ponts ParisTech. There are several users of X-band frequencies, thanks to the frequency filter a limited portion of the frequency spectrum will be used. Champs-sur-Marne / France; 2015. Photo credits: Igor Paz / École des Ponts ParisTech.
|
|
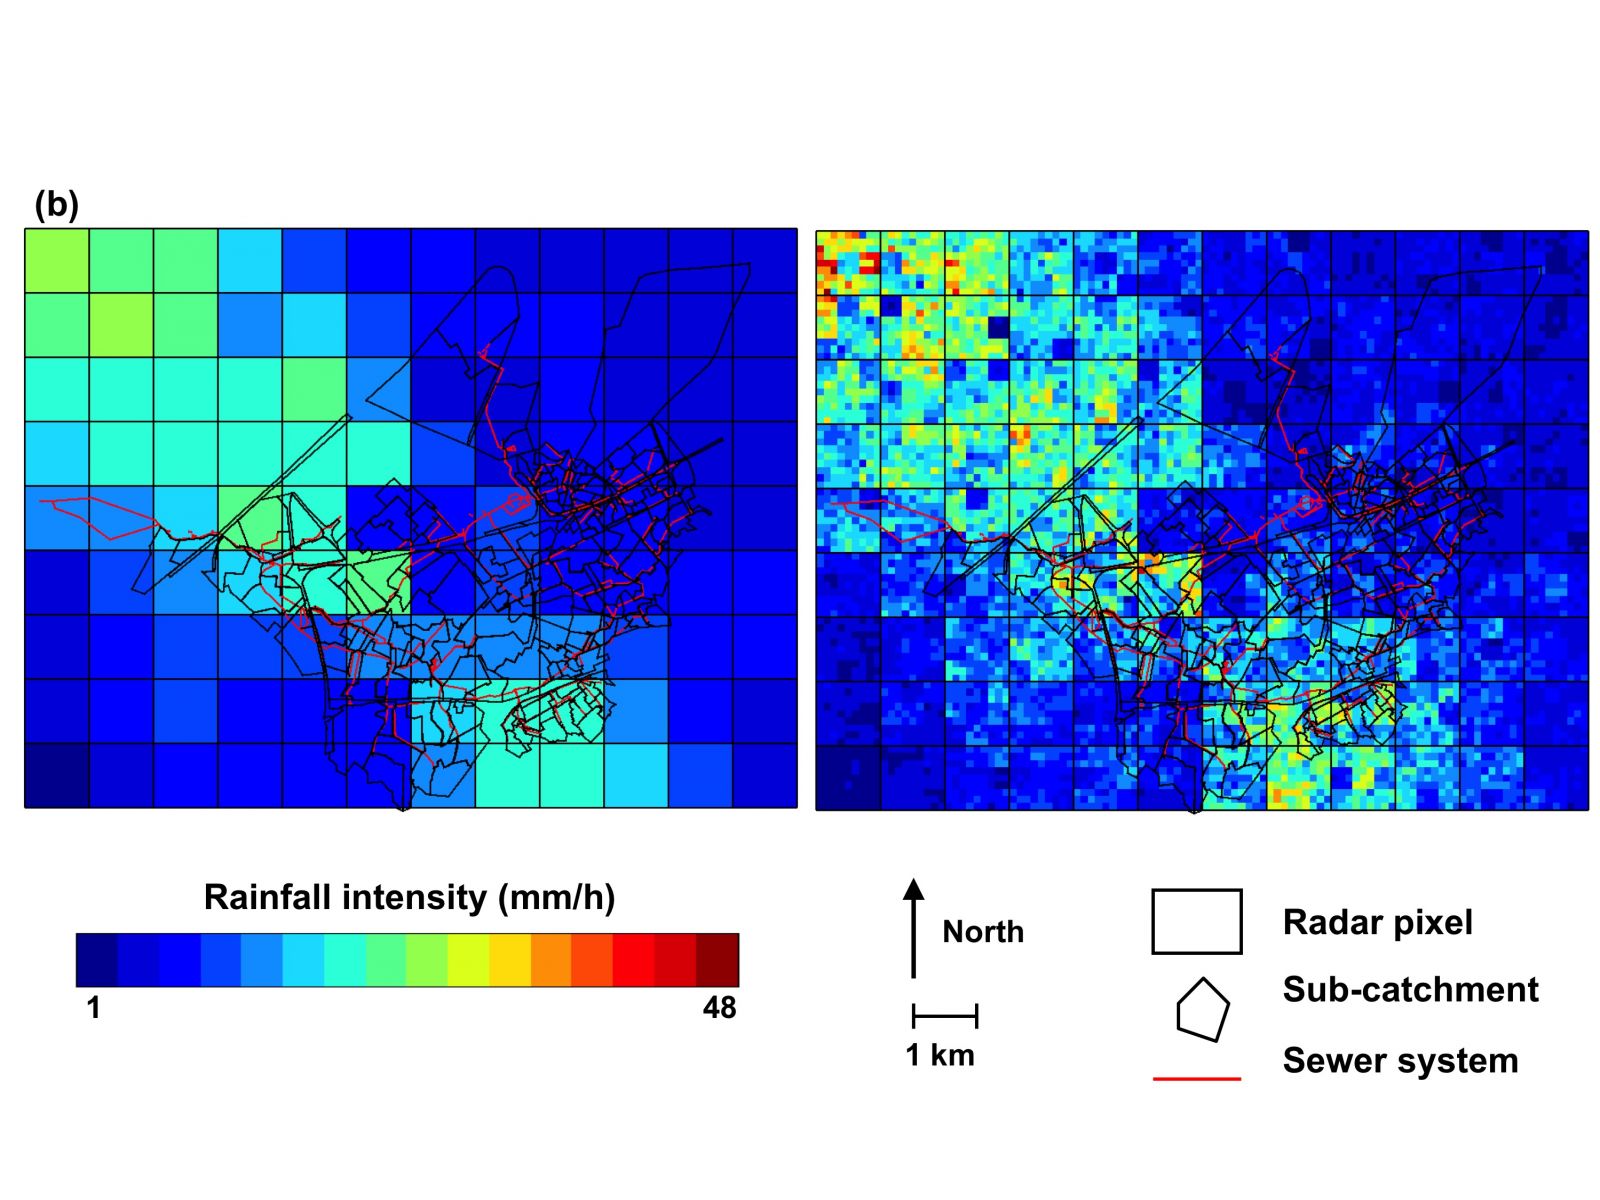
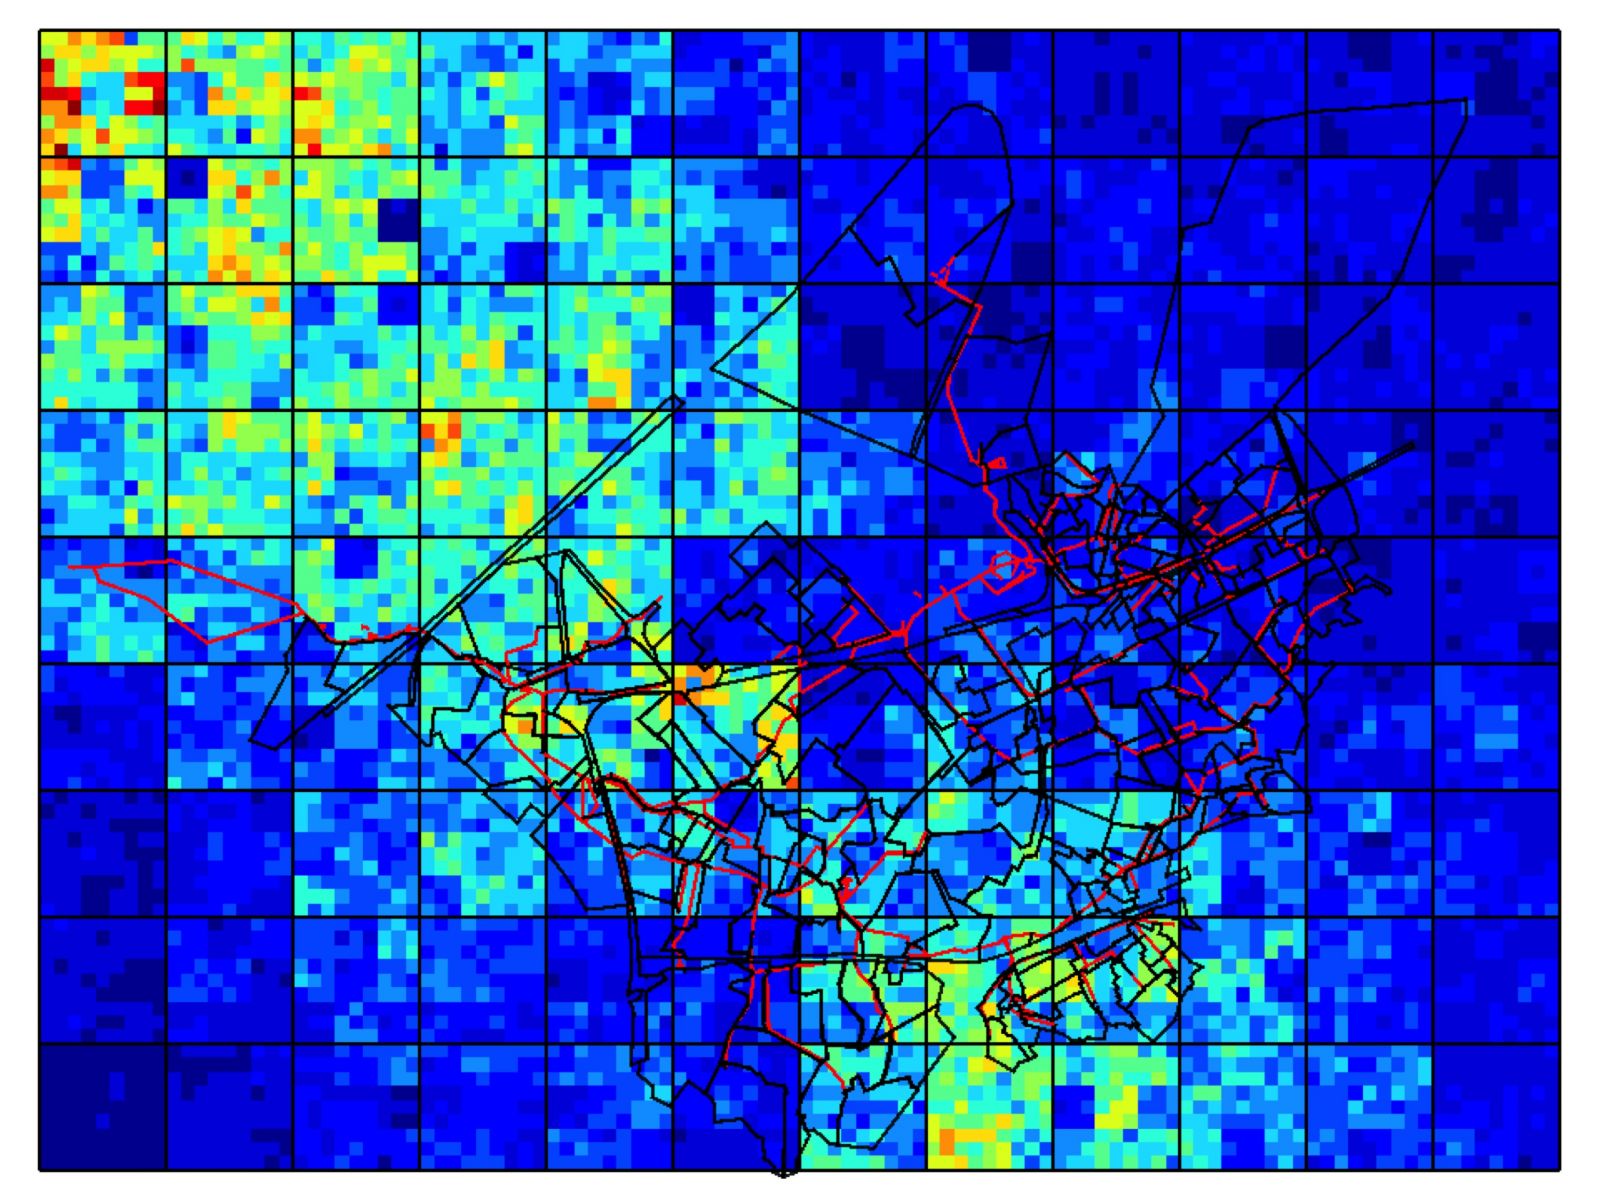
A comparison between a C-band radar image and the simulation of an X-band radar image of the same rainfall event. Credits: Auguste Gires / Ecole des Ponts ParisTech.
|
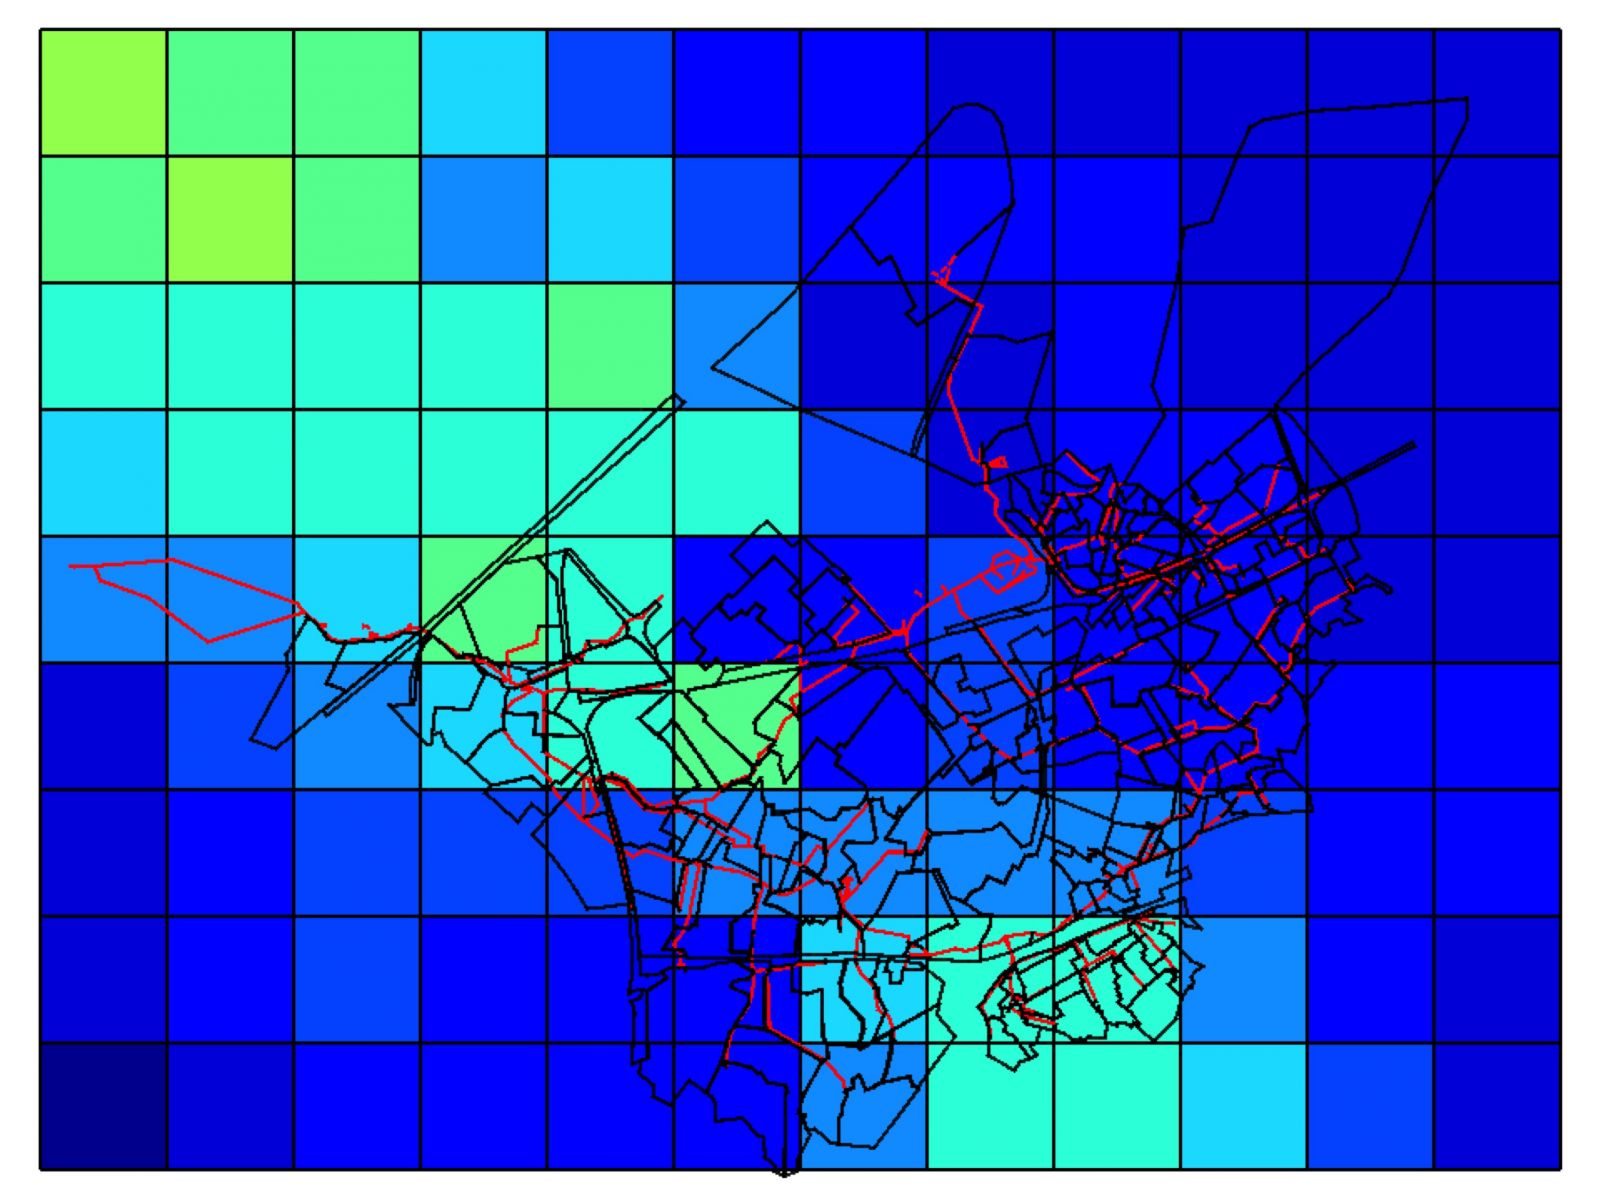
A C-band radar image. Credits: Auguste Gires / Ecole des Ponts ParisTech.
|
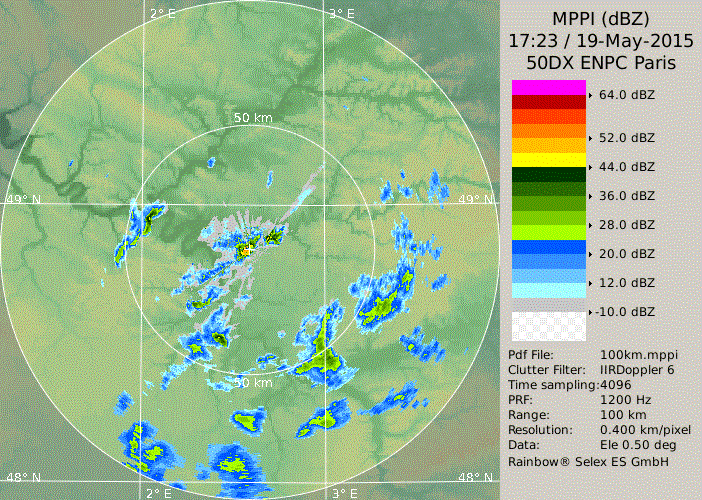
An X-band radar image of the same rainfall event. Credits: Auguste Gires / Ecole des Ponts ParisTech.
|
|
On the 19th of May a intenses and localised storm hit École des Ponts ParisTech and it was measured by the new radar. The yellow colour indicates where the precipition is more intense and the cross in the centre of the picture corresponds to the location of École des Ponts and its radar.
|
The X band is a segment of the microwave radio region of the electromagnetic spectrum. It is located between 8 and 12 GHz. Because of its low frequency, it is a non-ionizing radiation, in other words it hasn't enough energy to alter atomes and molecules (unlike UV and x-ray radiations). Credits Passyflore/École des PontsParisTech.
|
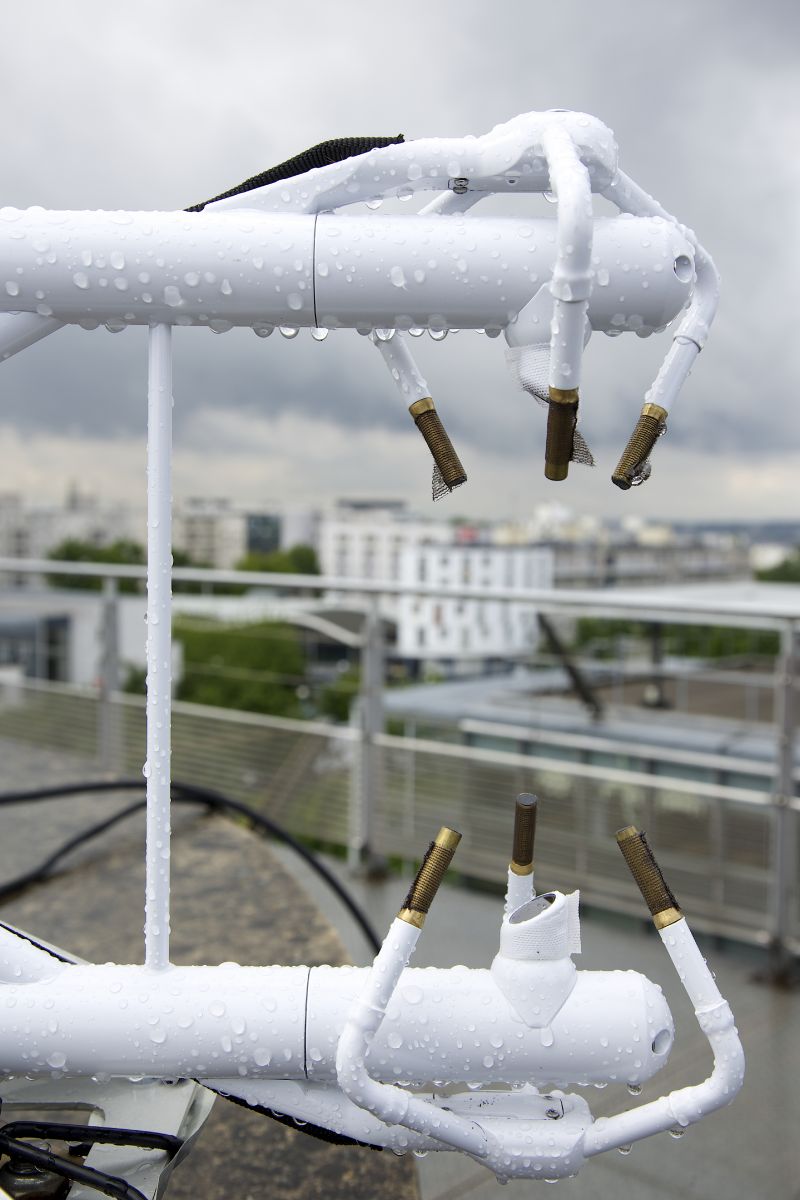
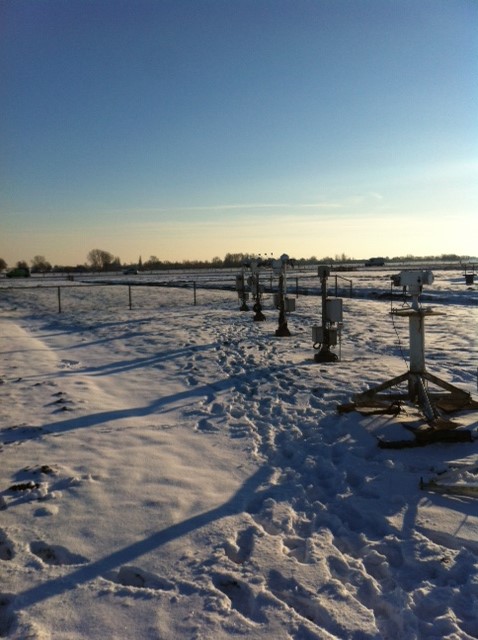
The IRGASON installed on the ENSG’s rooftop in Champs-sur-Marne is designed specifically for flux measurements and used for research on wind turbulence. Champs-sur-Marne / France; 2013. Photo credits: Caroline Rose / École des Ponts ParisTech.
|
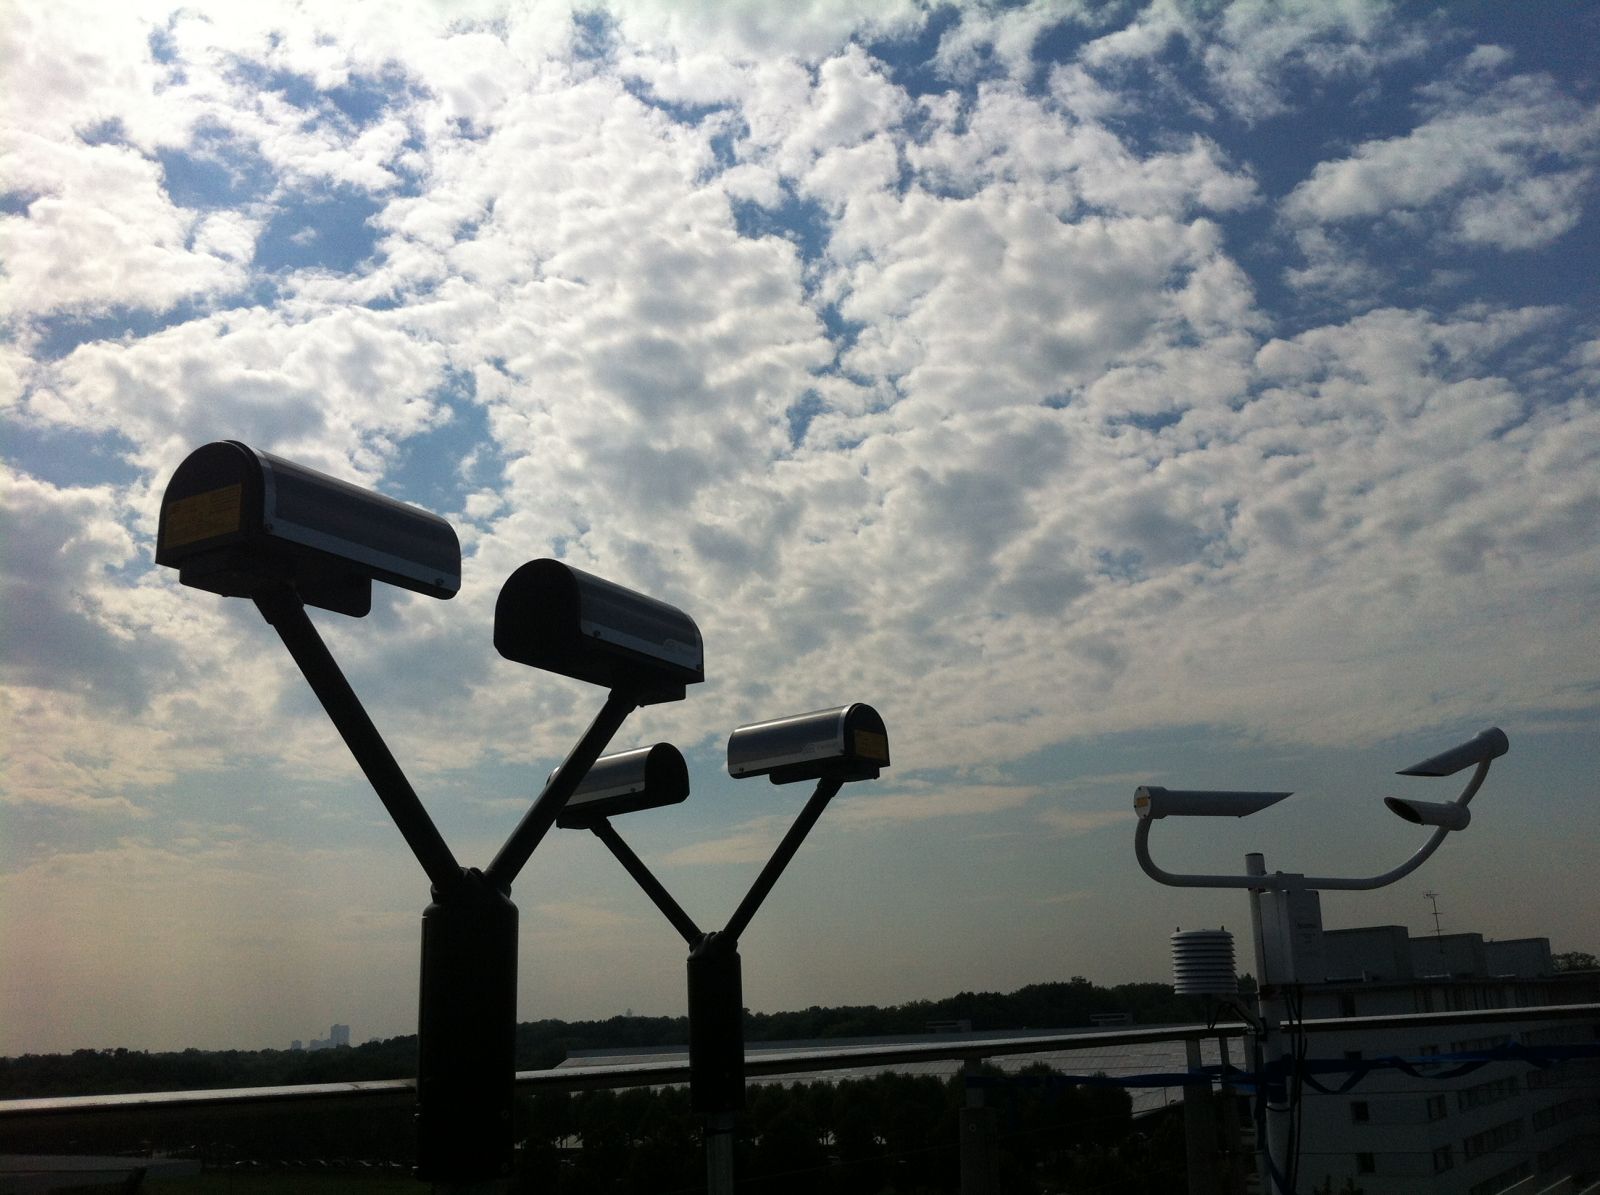 Optical disdrometers measuring the size and fall velocity of rainfall drops. ENSG’s rooftop in Champs-sur-Marne / France; 2013. Photo credits: Auguste Gires / École des Ponts ParisTech. Optical disdrometers measuring the size and fall velocity of rainfall drops. ENSG’s rooftop in Champs-sur-Marne / France; 2013. Photo credits: Auguste Gires / École des Ponts ParisTech.
|
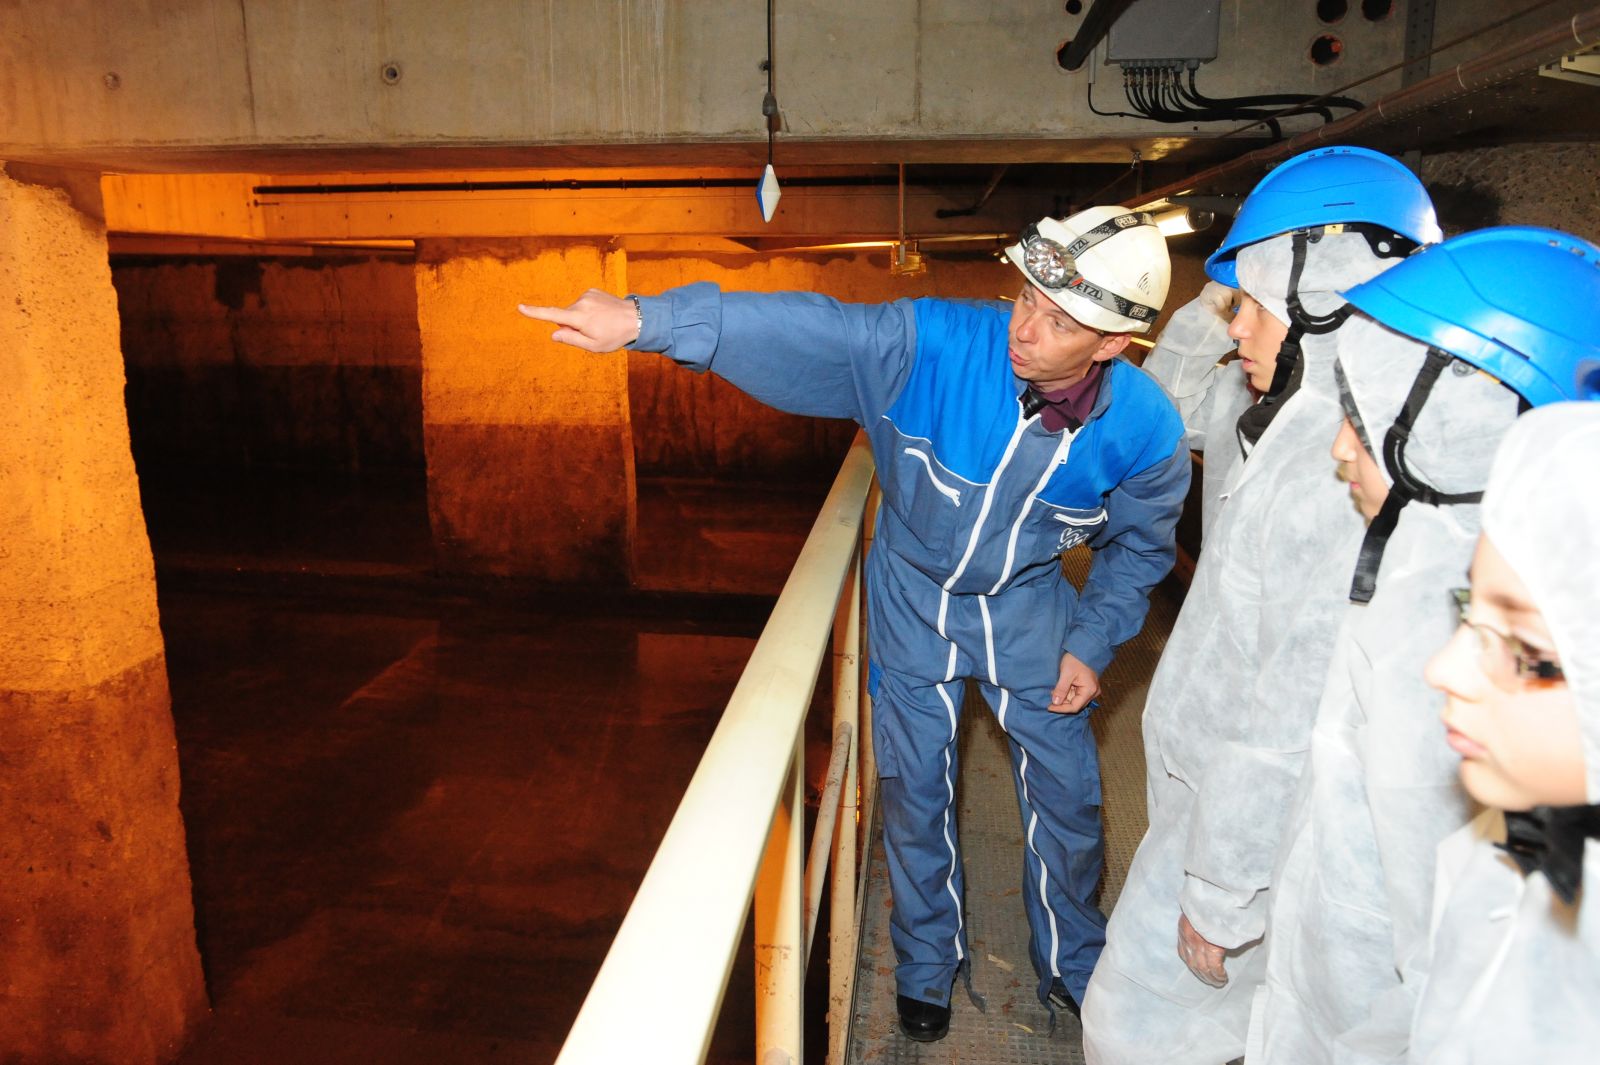 This water basin has two tasks: storm water retention and decontamination. Sucy-en-Brie; 2011. Photo credits: CG94 / Département du Val-de-Marne. This water basin has two tasks: storm water retention and decontamination. Sucy-en-Brie; 2011. Photo credits: CG94 / Département du Val-de-Marne.
|
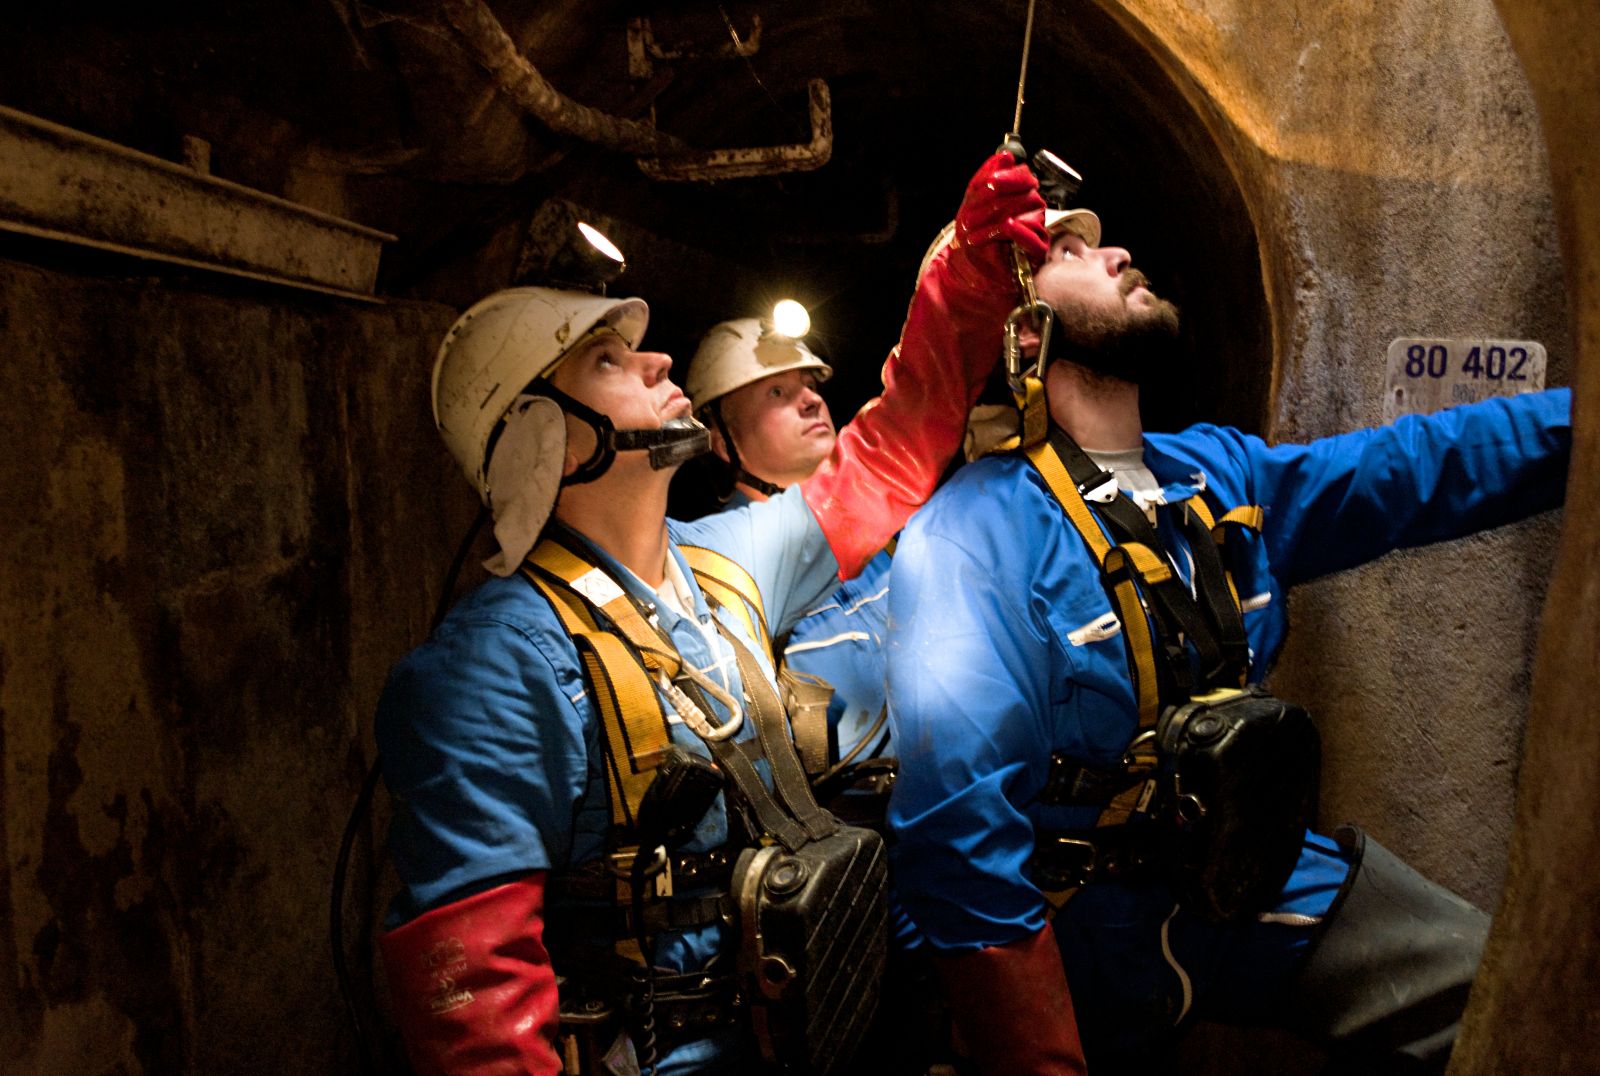
Sewer workers training. Sewer school in Alfortville / France; 2011. Photo credits: Sébastien Chambert, CG94 / Département du Val-de-Marne.
|
|
Departmental staff at work. Département du Val-de-Marne / France; 2011. Photo credits: James Belval, CG94 / Département du Val-de-Marne.
|
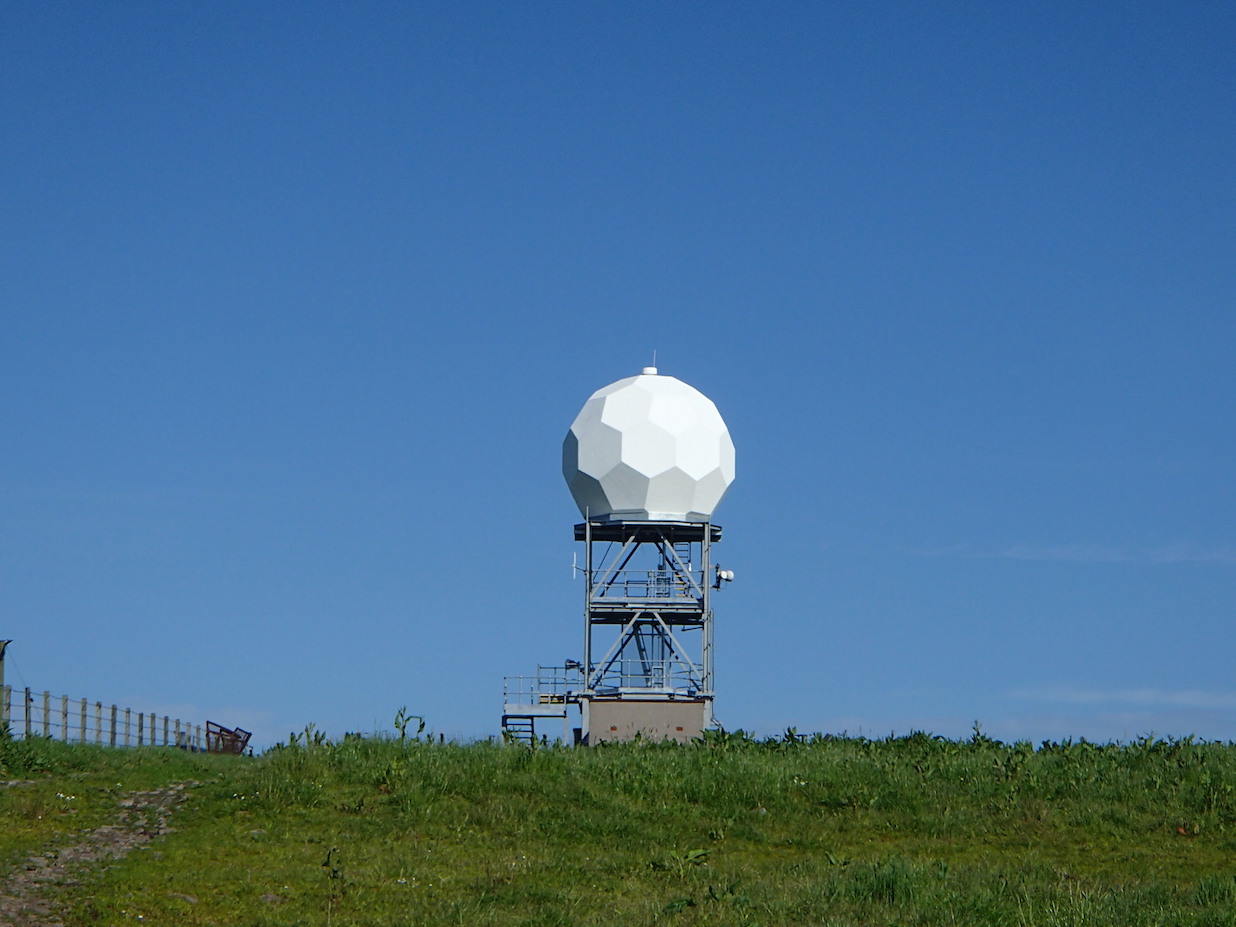
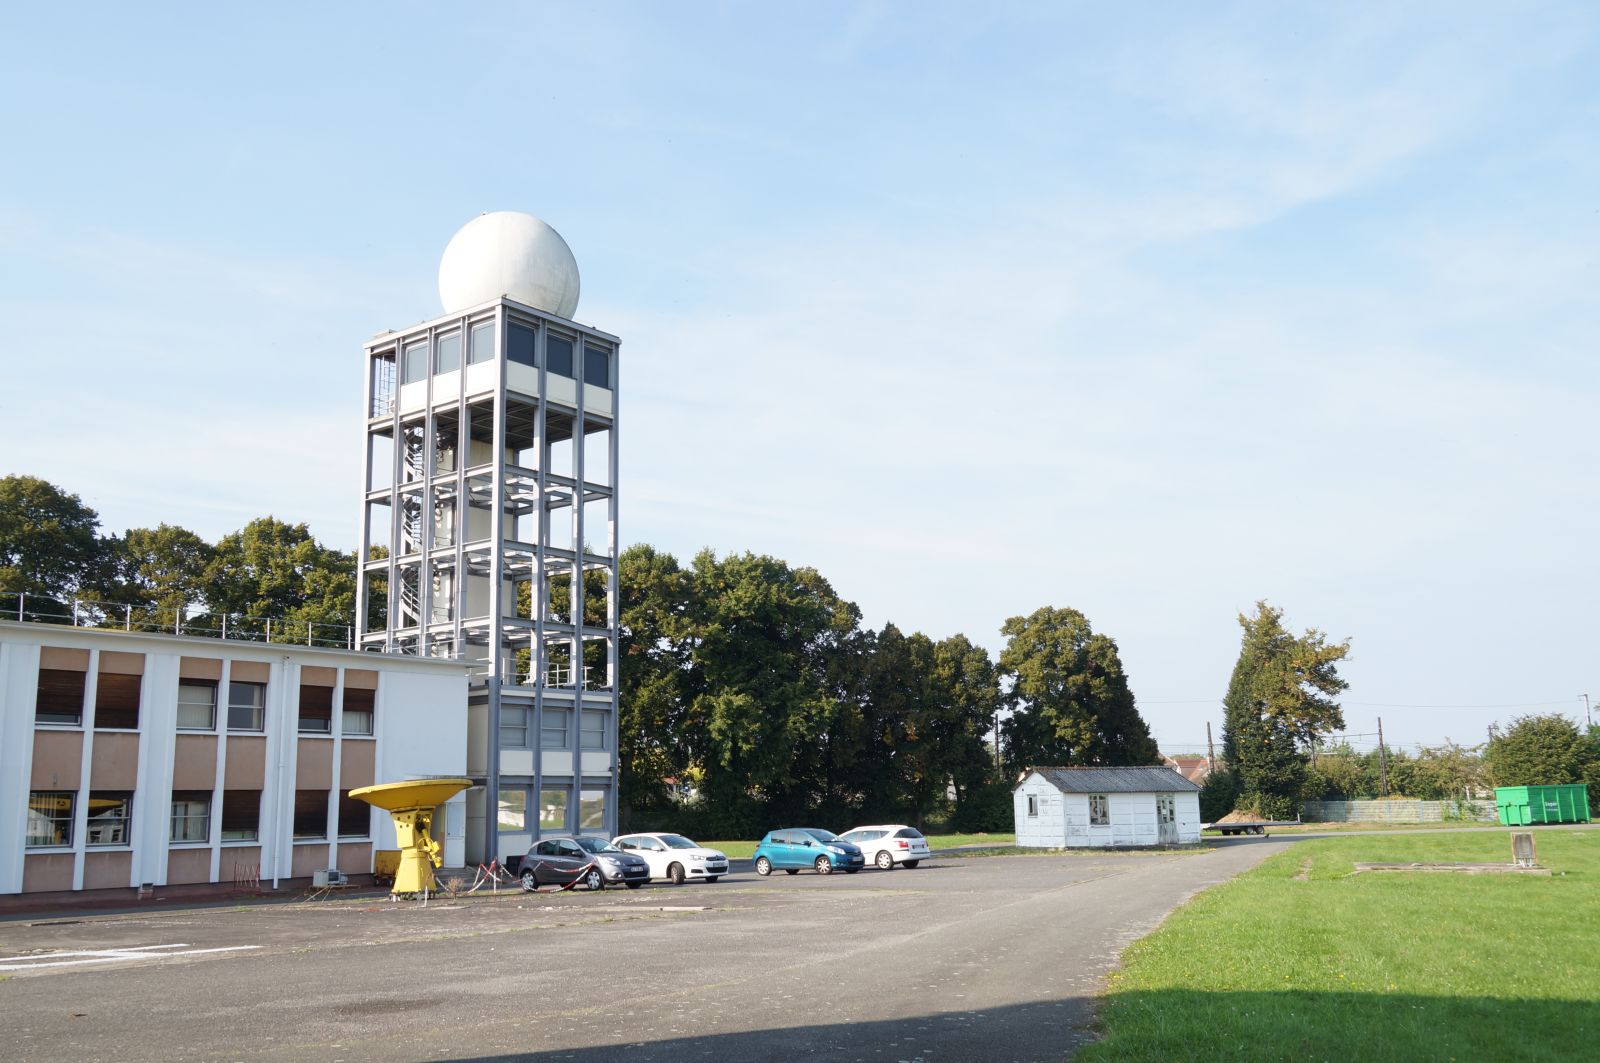
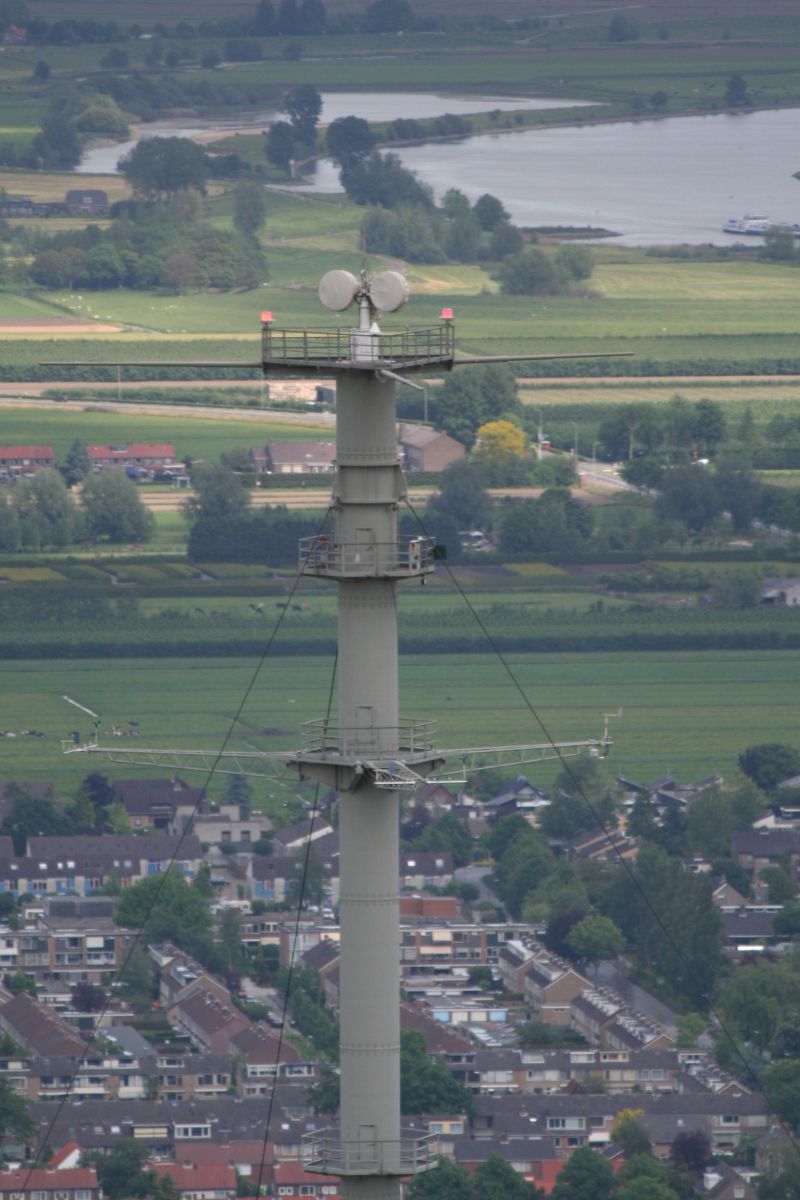
The Météo France C-band radar located in Trappes is currently used for rainfall measurements in Paris Region. Trappes / France; 2014. Photo credits: Rosa Vicari / École des Ponts ParisTech.
|
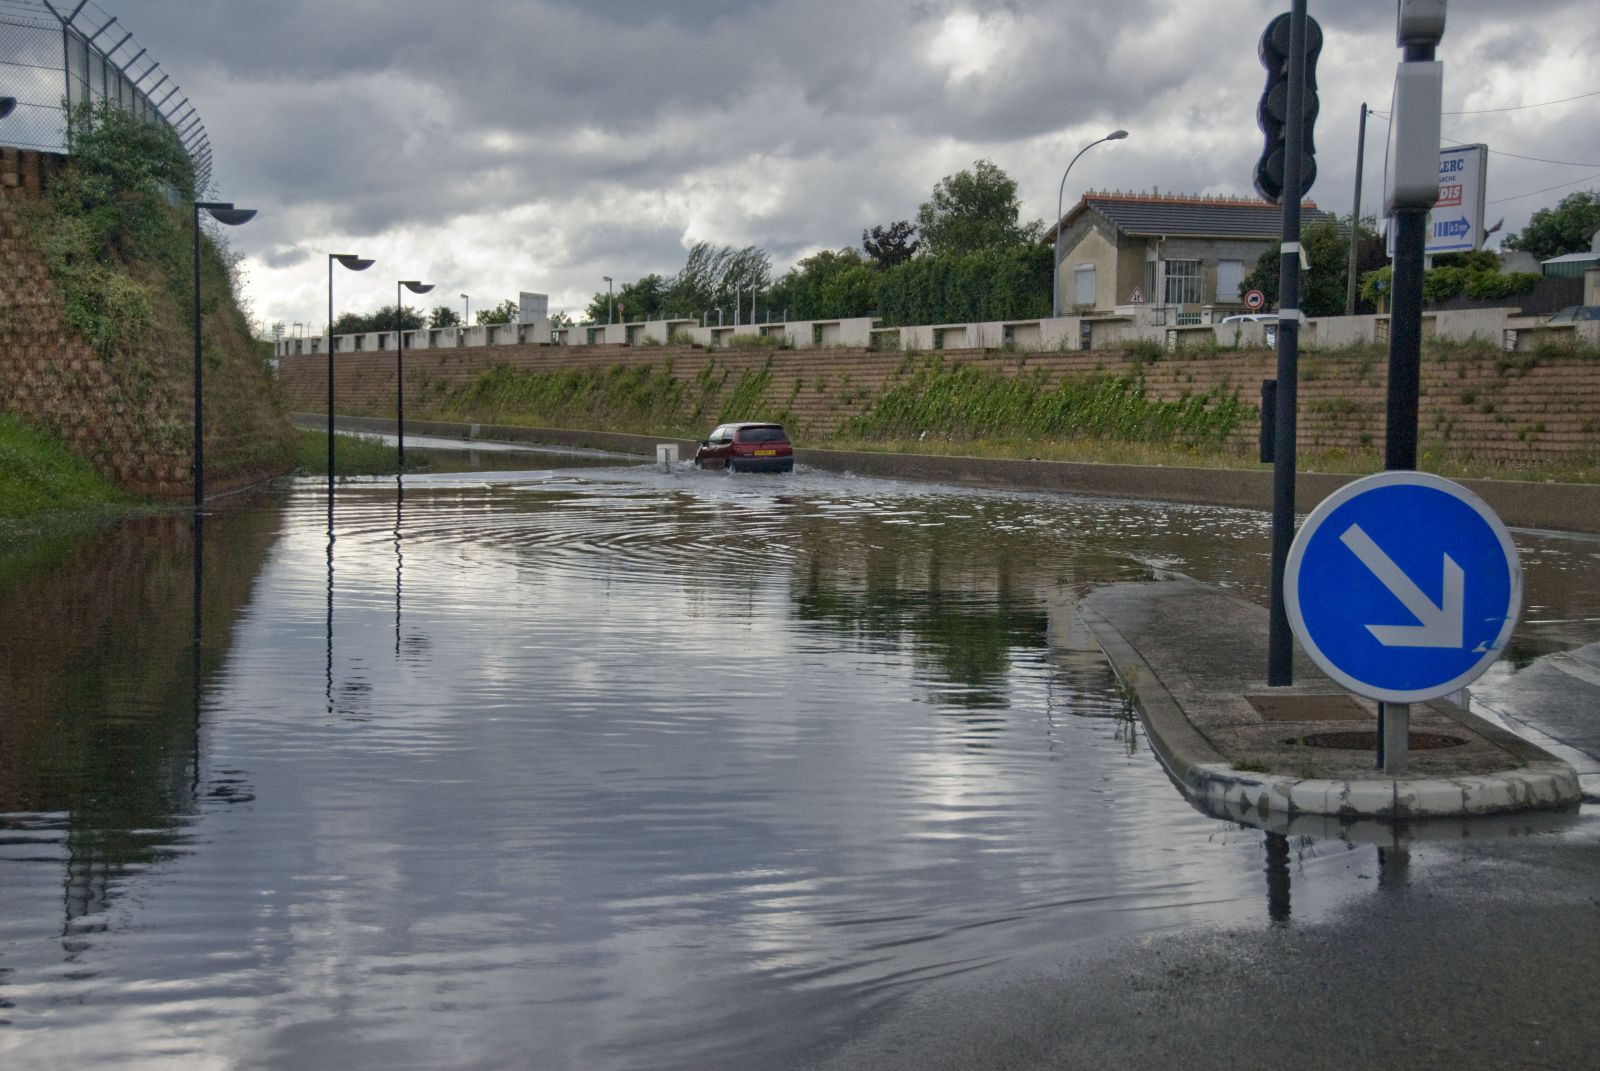
Flooded road. RD136, Orly; 2011. Photo credits : CG94 / Département du Val-de-Marne.
|



.jpeg)


.JPG)


%20copy%202.jpg)

.JPG)
.JPG)
.JPG)
